

In the grand scheme of things, how a team racks up results is a secondary concern, especially in a knockout tournament.
This match, with the roughly similar midweek match against Liverpool will make for easy comparisons but I think that these were very different performances. Liverpool felt like a classic smash and grab but this match against Manchester City felt that Arsenal executed their game plan and while I don’t think that they were the better team, the certainly were a team that held their own and came out deserved winners instead of fortunate winners.
Arsenal have a chance now to finish this very strange and very disappointing season on a high note.
Arsenal 2-0 Man City: By the graphs
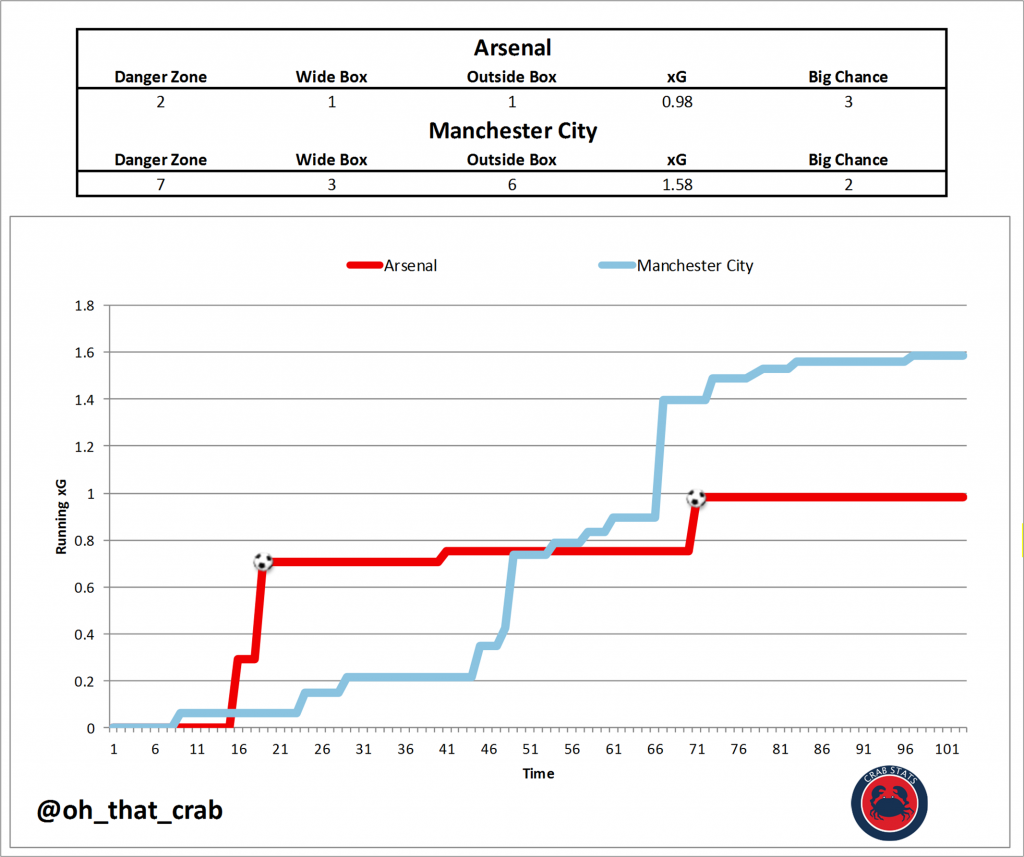
Running xG
xG Shot Map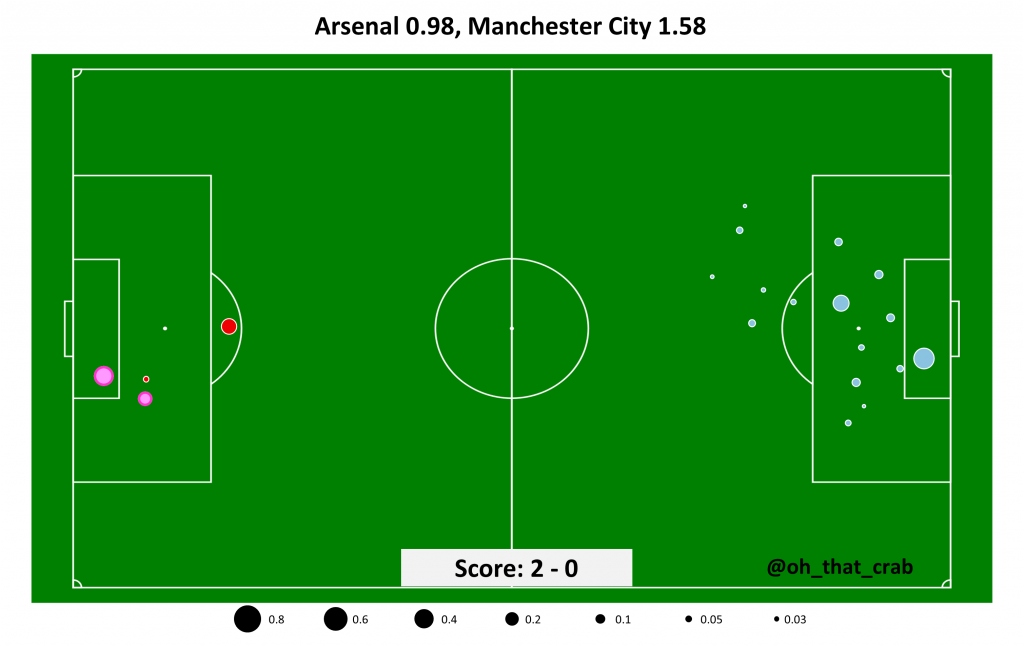
xG Shot Table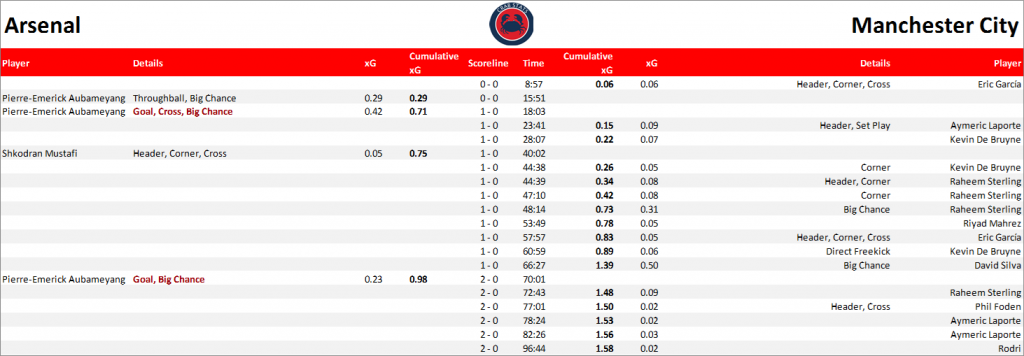
Simulated Match Result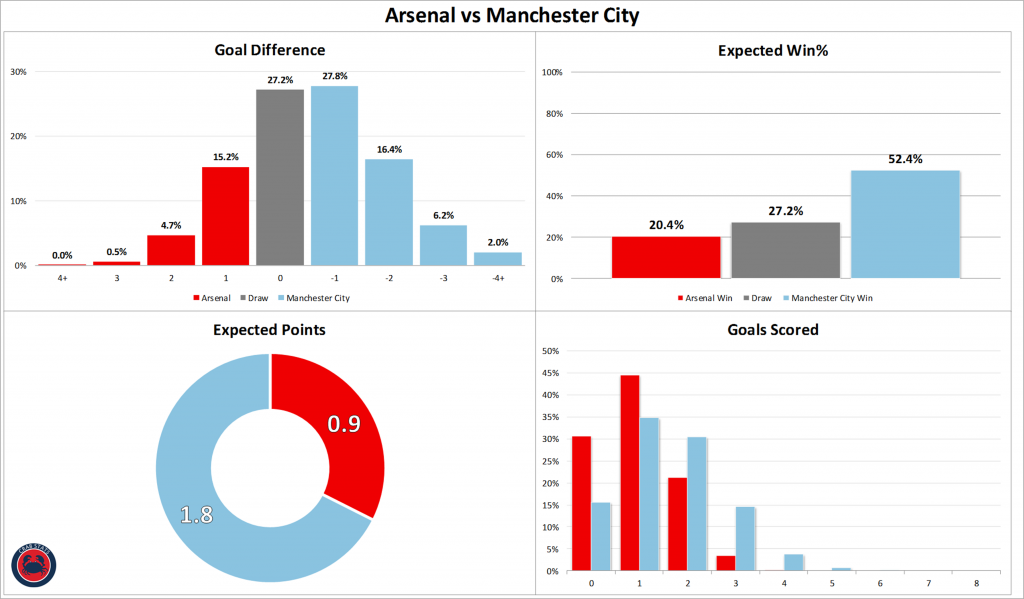
Arsenal 2-0 Man City: By the numbers
796 – Touches for Manchester City, 64% of the total for the match
314 – Touches for Manchester City in the final third, 84% of the total for the match
49 – Touches in the box for Manchester City, 82% of the total for the match
3 – Shots in prime for Manchester City
2 – Shots in prime for Arsenal
One of the major differences between this match and the Liverpool match for me is that Arsenal did an amazing job keeping Manchester City from taking shots in really dangerous positions. With the amazing talent that they have accumulated it is nearly impossible to keep them at bay for the whole match but Arsenal did an amazing job.
Here are the distances for the open play shots that Manchester City took in yards: 24, 14, 17, 5, 12, 15, 29, 23, 29.
To get these results often took some good last ditch defending but in this match (outside of one very nearly MUSTAFI moment) Arsenal were completely switched on and up to the task.
For Arsenal they were almost the exact opposite. The three shots that the took from open play the longest shot was Pierre-Emerick Aubameyang’s first shot with the distances of 19, 7 and 12 yards. Arsenal were very efficient in turning their possession into good shots.
Arsenal suffer together
90 – Total defensive actions by Arsenal (Manchester City had just 32 total)
45 – Clearances by Arsenal (led by David Luiz with 11)
13 – Interceptions by Arsenal (led by David Luiz with 4)
6 – Blocked Passes by Arsenal (led by Granit Xhaka with 2)
16 – Tackles by Arsenal (led by Dani Ceballos with 4)
5 – Blocks by Arsenal (5 players with 1 each)
This section really goes well with what was written above. Arsenal played tremendous defense to keep a very difficult Manchester City team at bay. The 1.6 xG for Manchester City is their 35th highest total this season of their 43 matches where I have the xG this season.
Bonus stat: 12.3% the probability of scoring 4 goals from the last 7 shots that Arsenal have taken against Manchester City and Liverpool.
@oh_that_crab
Sources: Opta via Whoscored and my own database.


I’m a little surprised that City’s XG is so much higher than ours.
Does anyone know – do blocked shots count towards XG? And does XG take into account when you are clean through on goal (like Auba’s second, and his miss before the first) or if there’s defenders around? We did an excellent job crowding out shooters.
I wonder if that cross that hit Sterling in the face counts as a shot near goal too!
Either way, very interesting stats as always – thanks crab!
I think different xG models take different things into account. Some models count blocked shots, some don’t (yet). Most of the models consider the defenders around the shot taker. Opta & Statsbomb models are two of the best & most advanced…
I think statsbomb even takes into account the footedness of the player taking the shot and the position of the defenders relative to that foot.
The short answer to both of your questions is yes. The longer answer is that it depends on the xG model, as they are all a bit different. xG takes into account the number of defenders between the shooter and the goal, so the odds of it getting blocked are incorporated into that. You can this on the shot map. Even though some shots look like they are in better locations than others their xG is smaller because those shots were taken with defenders in the way. In other words, there is an average percentage of shots with, say, 3… Read more »
Thanks for replies – interesting to know!
In my model blocked shots do count. The xG is a freeze frame in time essentially where it only takes information that went before the shot into account but not anything after the ball has been struck.
Why does City have higher xG inspite of having lesser big chances and lesser shots on target? Absolute bullshit of a stat
Because they had more than 3 times as many shots as us, along with 2 of them being very good chances. It’s really not that hard to understand.
It kind of shows up the measurement a bit though, doesn’t it? I mean, it is usually a good reflection of a team’s dominance during a game but it’s not fool-proof.
It’s like saying if someone tried to throw a dart at bullseye from a distance where the likelihood is 1 in 100 (or 0.01) based on what’s happened before, they’re more likely to get a bullseye if they take 100 throws than someone who throws from a distance where the likelihood is 99 in 100 but they only have one throw.
It’s not a flaw in the measurements. It’s just how probability works. We can actually work out which is more likely in your example. The odds of getting at least one bullseye is the same as 1 minus the odds of getting no bullseyes, because if you don’t get no bullseyes you must have gotten some bullseyes.. To get no bullseyes, you have to miss the first and the second and the third etc. Mathematically, this is 0.99*0.99*0.99…. = 0.99^100. So the odds of getting at least one bullseye are 1 – 0.99^100 = 0.634 = 63.4%. So no, the… Read more »
This actually a good example of why you would rather have 1 really good chance instead of a lot of poor chances. The total probability of goal is higher with the 100 1% chances than it is with 1 99% chance but you will win more often with the 99% set of shots.
https://danny.page/expected_goals.html?share=AwOmEYBpQ6ymD51olTXLdrvP40PWJwJLyNMovLKturpvpebaY8a4Z9c9-bc+QwQP7CxIiAB9QATjlA
Thanks for replying Scott. That is the point I’m making, though. xG makes sense on a shot-by-shot basis, but the cumulative figure doesn’t tell you anything – that’s not how probability is calculated, as confirmed by you and Trent above.
The sum of lots of low value xG doesn’t mean you created anything dangerous. You could have 20 shots from the half-way line and you’d be unlikely to score.
This xG model only looks at the probability of converting shots before knowing where the ball ends up. City took more shots and still managed to have a few good chances of scoring thus the higher xG.
The fact that Auba’s first goal had a higher xG than both his missed chance and the second goal is telling of how poor this stat is.
It’s not. It’s telling of how hard it is to judge by eye precisely (precisely being the key word) how easy or difficult a chance is.
Well, timing your jumb, to stick a leg out, to hit a curling ball coming from the sky, and send it in through the post, from a tight angle
in my book,
is so much harder than fininshing a 1v1 with the ball controlled, from the middle, even though your are some yards further.
I wouldnt agree with Mentalista, even tho he makes a good point. It is just a tough stat to calculate.
This is where I’m not sure I agree. Once Auba gets to the ball, Ederson has no time at all to react because it is so close to the goal. As long as the ball is on target and not straight at Ederson’s shins, it’s going in. He does phenomenally well to get to it, truly I don’t know anyone else in the Premier League with the movement, pace and athleticism to even make contact with it. And once he does make contact with it, the odds are pretty good (still well less then 50% mind you, which shows you… Read more »
“Well, timing your jump, to stick a leg out, to hit a curling ball coming from the sky” Yes this is a good point. These shots can very often turn out as a complete 0 because no shot is often recorded because most players don’t have the ability to even get into position to take this shot.
xG. Expected. Goals.
Expected.
Tell me out of 100 chances like that you expect 42 to go in.
And out of 100 1-on-1s you expect only 23 goals
Okay….
Well, yes. That’s literally how it is calculated. They have looked at literally thousands and thousands of shots by professional footballers from those exact spots and found that yes, in fact, 23 of those specific one on ones (where the shot is taken from the middle of the goal by a right footed player on the edge of the 18 yard box with a defender closing down from the right) goes in 23 percent of the time. Whether or not you believe that is true won’t change whether it is or not. So yes, that is exactly what I am… Read more »
29% I should have said, I was talking about Auba’s miss. Either way, the point stands. How do you think xG is calculated?
Calm down, I know you’re right. 🙂 I have no problem with any of that. My point is when statisticians create these models they need to standardise every situation in order to compare them. There are so may variables that if they miss a single aspect of the situation it might competely throw off the model (for that specific goalscoring chance). Another example is Silva’s big chance. Does xG consider where the ball was coming from? 0.50 would sound right if the cross came from the left and he was at the back post for an easy tap in, but… Read more »
While i generally agree with your point, i think it is important to recognize that XG models involve some level of generalization, in that the probability computation is based on “similar” situations, but not necessarily exactly that situation. The degree of similarity between the actual game situation and the situations used to estimate XG depends on the various parameters incorporated into the model (as noted above, they can be more simple, or more complex incorporating the player’s footedness, etc.). In the particular example of Auba’s first goal, it is likely that this situation, even once ball contact is made, is… Read more »
I think given 100 chances to make contact with the ball from that location he scores a similar but perhaps slightly less clip (I’d probably say more around 30-35%. If it is give him 100 crosses and not counting him getting the foot to the ball it is significantly less, the hard part of the goal was the timing of getting to the ball and making contact.
On the first I think that xG feels about right.
Stats warrior. We get it.
The first one is a very good chance but it is also pretty far out which makes the shooting area relatively small with Ederson bearing down on him. The second one takes a ton of athletic skill to get to the spot where he can even take the shot (which xG doesn’t take into account and certainly makes this a harder chance) but once he got the foot to the ball given the distance/angle etc historically that is scored at a higher rate. The thing to remember is that examining a single shot (or even shots for a match) will… Read more »
Absolutely Scott, sorry for the harsh words.
Still think this is a young field and with time your good work will get us better models.
Does xG take into account the player taking the shot?
I. E. If Messi and Titus Bramble had the same shot in the same place with the same defenders in the way would it be a higher xG for Messi?
Because I’d have bet my house on Auba scoring that second.
It doesn’t, but the effect of individual players is surprisingly small. Even a player like Messi, who is easily the best finisher soccer has ever seen, is only 10%-15% better than his xG throughout his career. Auba is not a player that has systematically outperformed his xG to an enormous extent. So the answer is no, but the effect is much, much smaller than you would think even for the very best players in the world. In general, the best players are good because they get lots of very good chances to score and not because they never miss chances.… Read more »
It does, however I do remember him outperforming his xG by quite a bit recently (last season?). I think he was finishing at something ridiculous like 20%. I wonder what he’s at now. Also my point was more related to the type of chance… When he’s bearing down on goal from the left in that Henry-esque style he doesn’t seem to miss too many of those. Also put Giroud at the near post and he finishes a lot of those with his shovel-flick thing. Ozil with the keeper coming out towards him bouncing it into the ground. Monreal running in… Read more »
Ah, you were correct – 20% is what he should’ve been finishing at, it’s just that he gets in good positions where he’s got a high xG!
Exactly. For example, I think that if you swap Laca and Auba around when Pepe hits that cross, Laca doesn’t get on the end of it and we end up with 0 xG. No disrespect to Laca, he has his own skills, but that goal is a perfect example of why Auba is so good.
Maybe. I’m not aware of any data regarding specific types of finishing like you mention. It’s an interesting point though, and one I hadn’t thought of. If a player is really good at a particular type of chance, that could definitely explain a lot. My initial instinct is that it probably isn’t true, but I don’t know. I like it as a way to explain why players and teams go on weird streaks. If a player keeps getting the type of chances he likes, then he is going to look very good compared to his xG. It would look like… Read more »
And yeah, his finishing during Emery’s unbeaten run was insane and the on main reason we were winning so many games. However, that also demonstrates why it shouldn’t be relied upon. We all saw what happened to Emery when that insane overperformance dropped to regular overpeformance.
Not exactly but there is some of that just because your everyday Titus Bramble don’t make it to the top the Footballing pyramid. So it is built looking at the top 1% (maybe even higher when you consider that the share of shots skews towards good players) of players.
Hi Scott, thanks for the insight!
It would be nice if you make a comparison “by the numbers” between the two EPL games we had with Liverpool. The one with Emery and the one with Arteta.
Both of our setups were defensive but yet, in the first one we looked afraid and cornered waiting for the bashing to stop and the later one we looked focused with a plan to damage them.
What do you think?
I second this. I would also like to see the difference between the City game before Arteta took charge and this one. We can’t use the other most recent one because of Luiz’s red, unfortunately. I’d be most curious about the pressures and defensive actions, as these have been the most obvious changes and I’d be curious to see if what we see with our eyes is reflected in the stats.
Those might be interesting things to take a look at. I am just coming back from a vacation (the reason for the delayed posts) so i will have to see what the day job allows for.
I appreciate the effort that goes into the the XG sat and that it’s impossible to keep the judgements objective in principle but the 2nd Auba goal is a far easier finish that the 1st one. Once he has gotten into the positions (overloking the run with the ball etc) you finish the 2nd chance more often. I know he’s closer and the keeper is moving accross goal but he can’t just side foot that in. You suggested that his first chance that was saved was harder due to the defenders position, we’ll his 2nd goal is easier because the… Read more »