BOURNEMOUTH 0–4 ARSENAL: BY THE VISUALS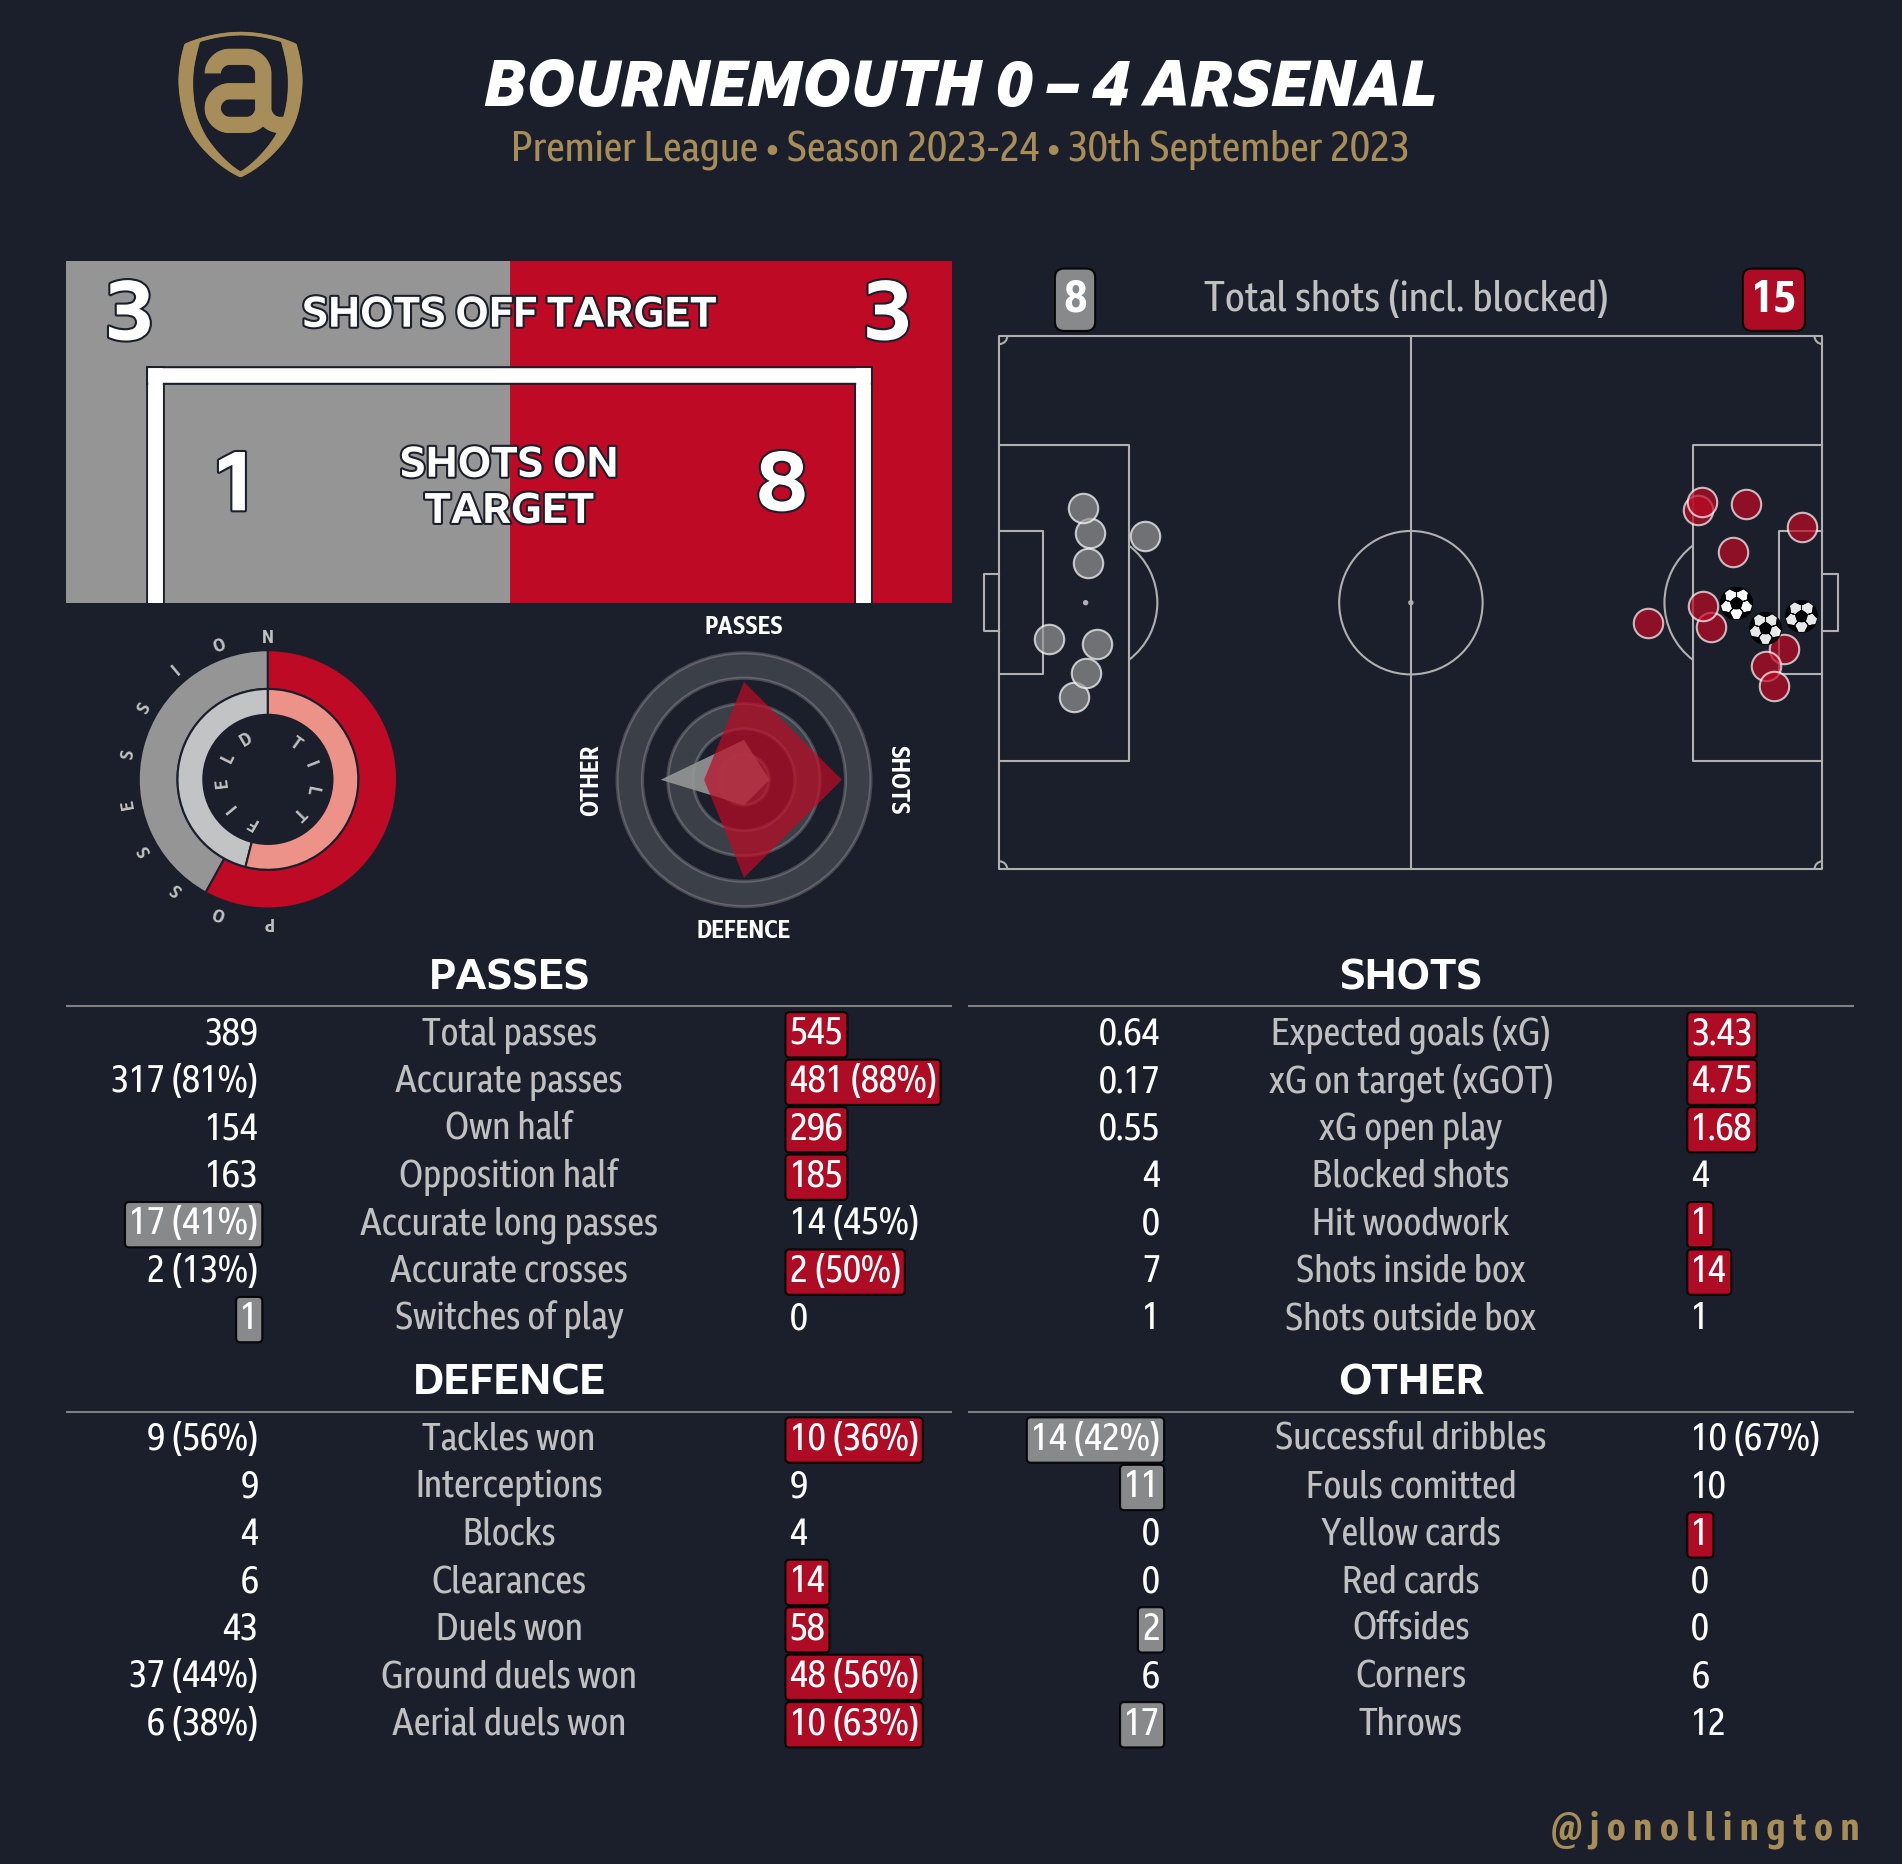
BOURNEMOUTH 0–4 ARSENAL: BY THE NUMBERS
After the disappointment of last weekend’s North London Derby, it was essential for us to secure maximum points against lowly-placed Bournemouth. The problem with Man City’s perfection (pre-kickoff) and our lofty expectations is that every draw feels like a loss. What exacerbates the disappointment of these draws is knowing they were all but avoidable if we had somehow cutout the individual errors that seem to be piling up, along with the list of reported injuries heading into the fixture.
However, the landscape of Premier League football can change quickly.
The good news began with Saka, Saliba, and Rice all being fit enough to start. It continued with City being humbled at Wolves, as we scored four away goals without reply on the South Coast. Suddenly, those draws didn’t seem as rough, with just a single point separating Arsenal from the league leaders by the end of the 3pm kickoffs.
3 – Arsenal have won their opening three away games in a top-flight campaign for just the fourth time (also in 1930-31, 2004-05, and 2013-14), and it’s the first time we’ve done so without conceding a single goal.
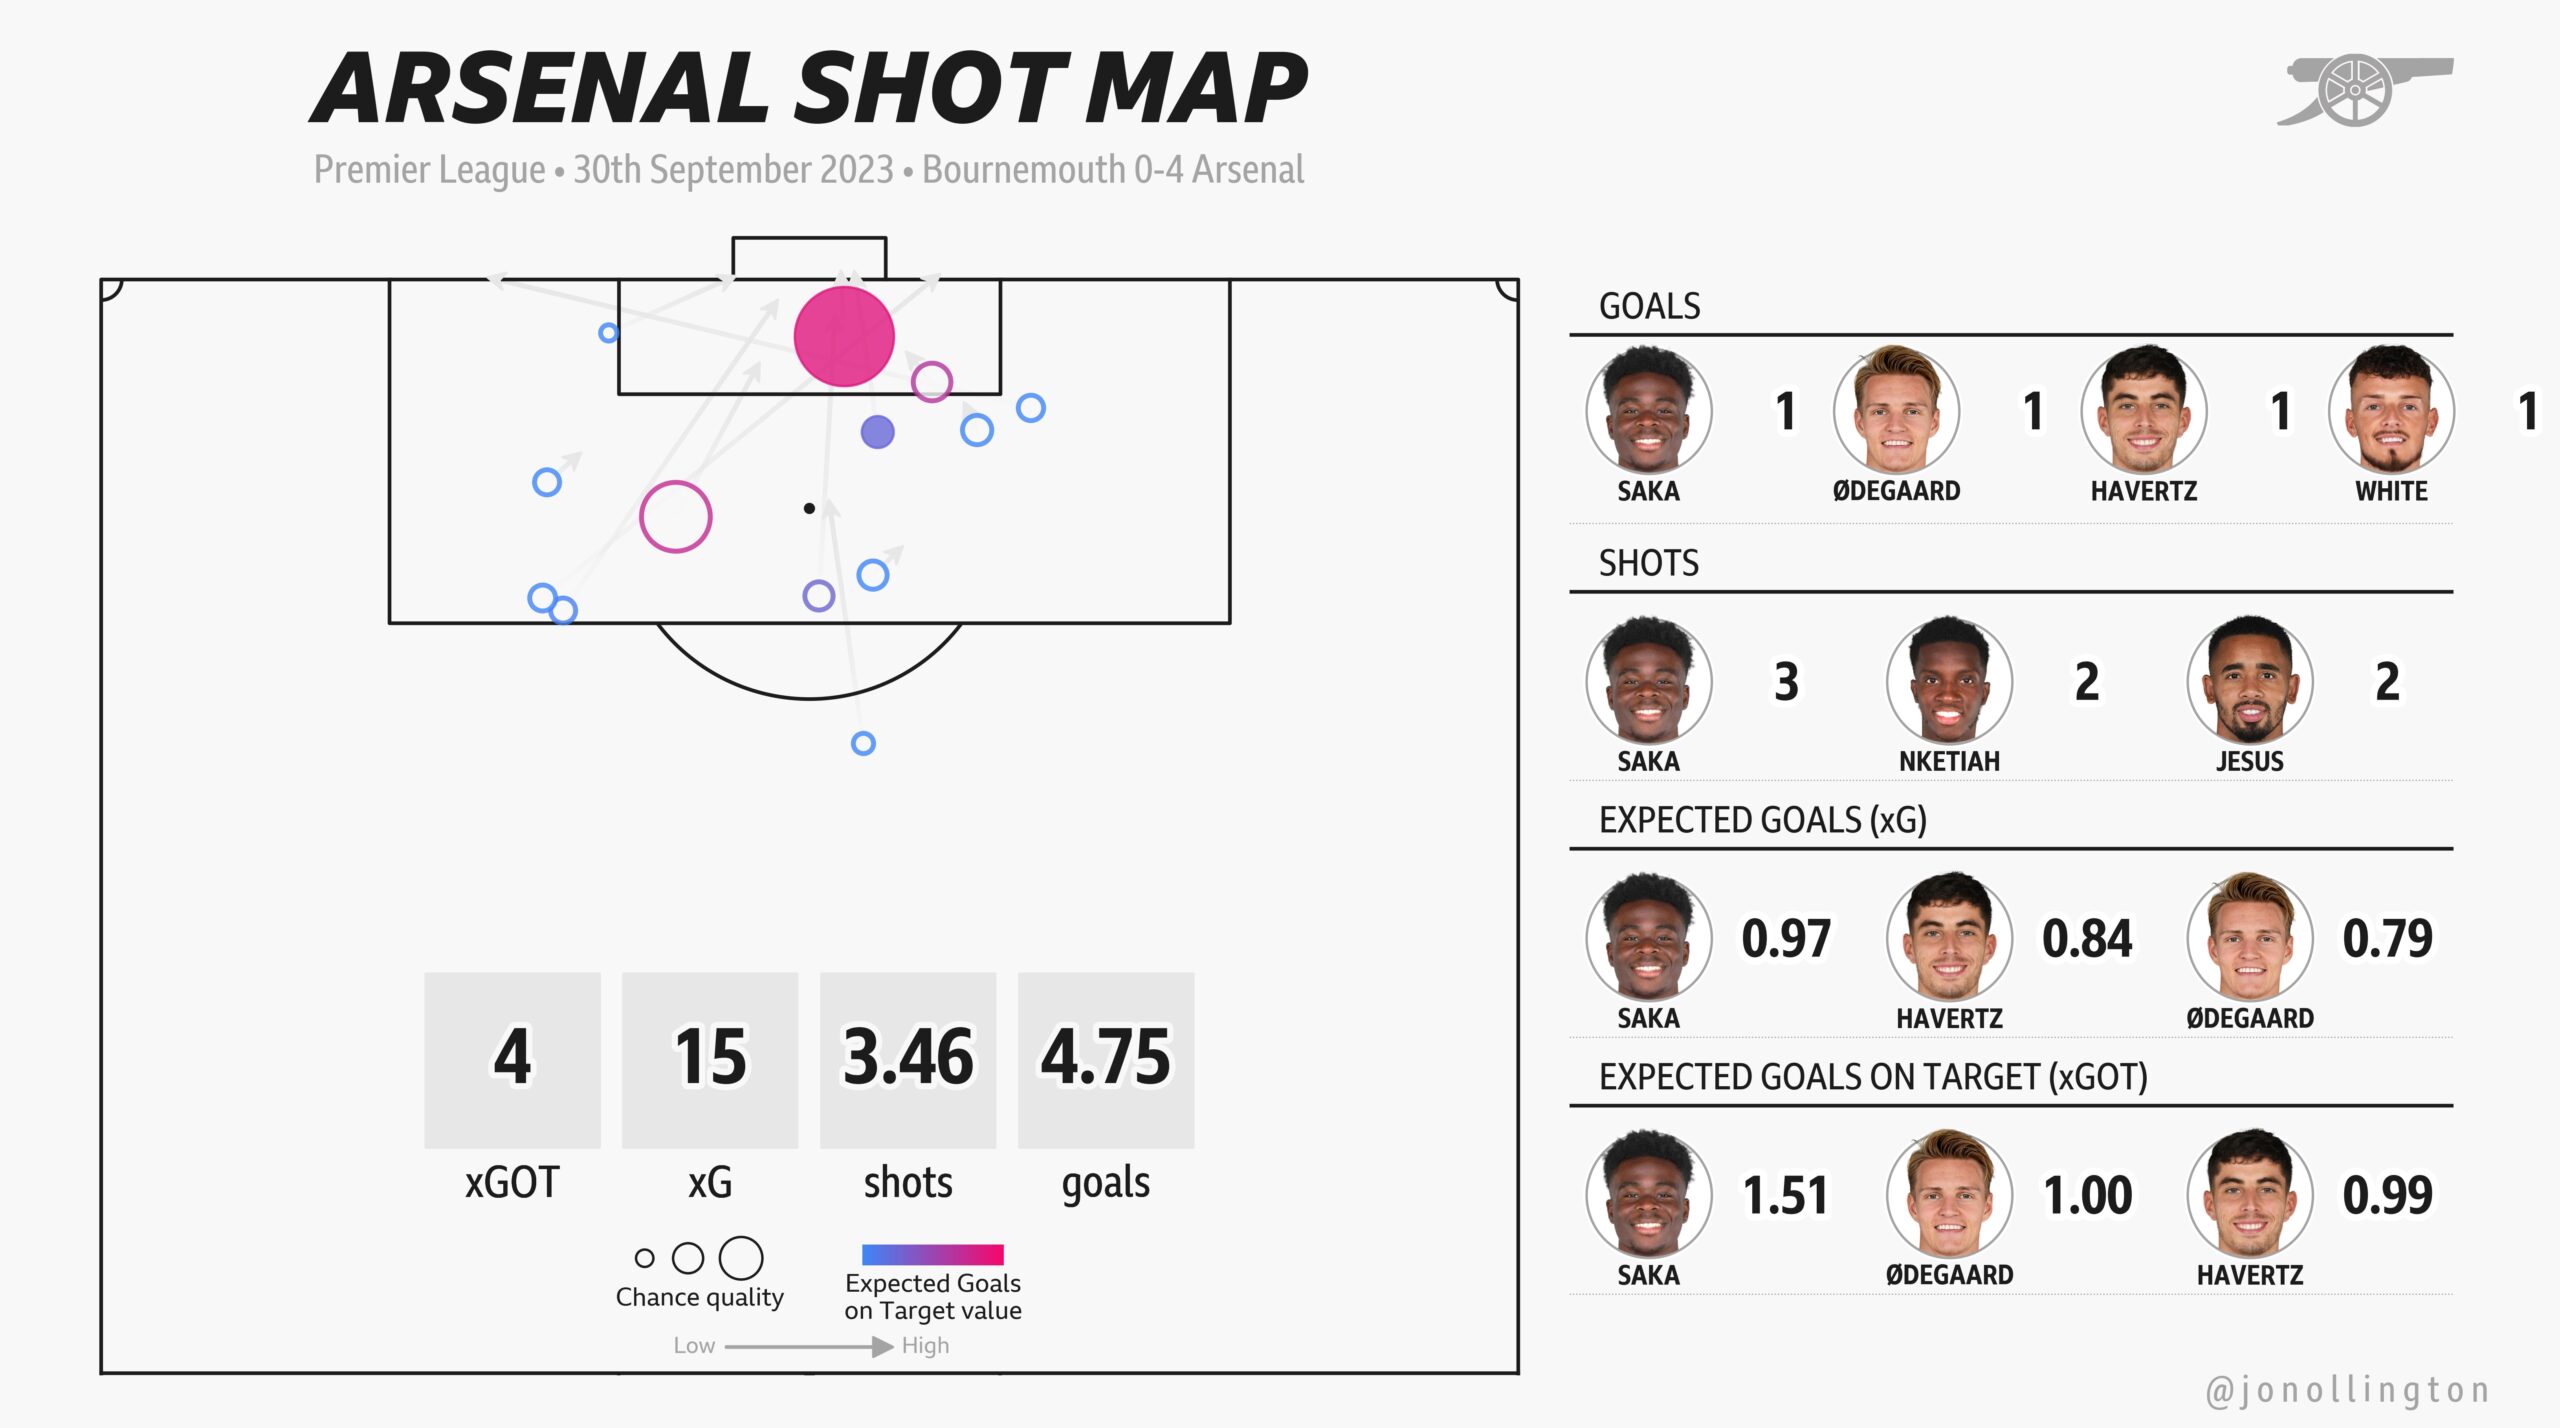
4 – The second time this season that Arsenal have scored 4 goals.
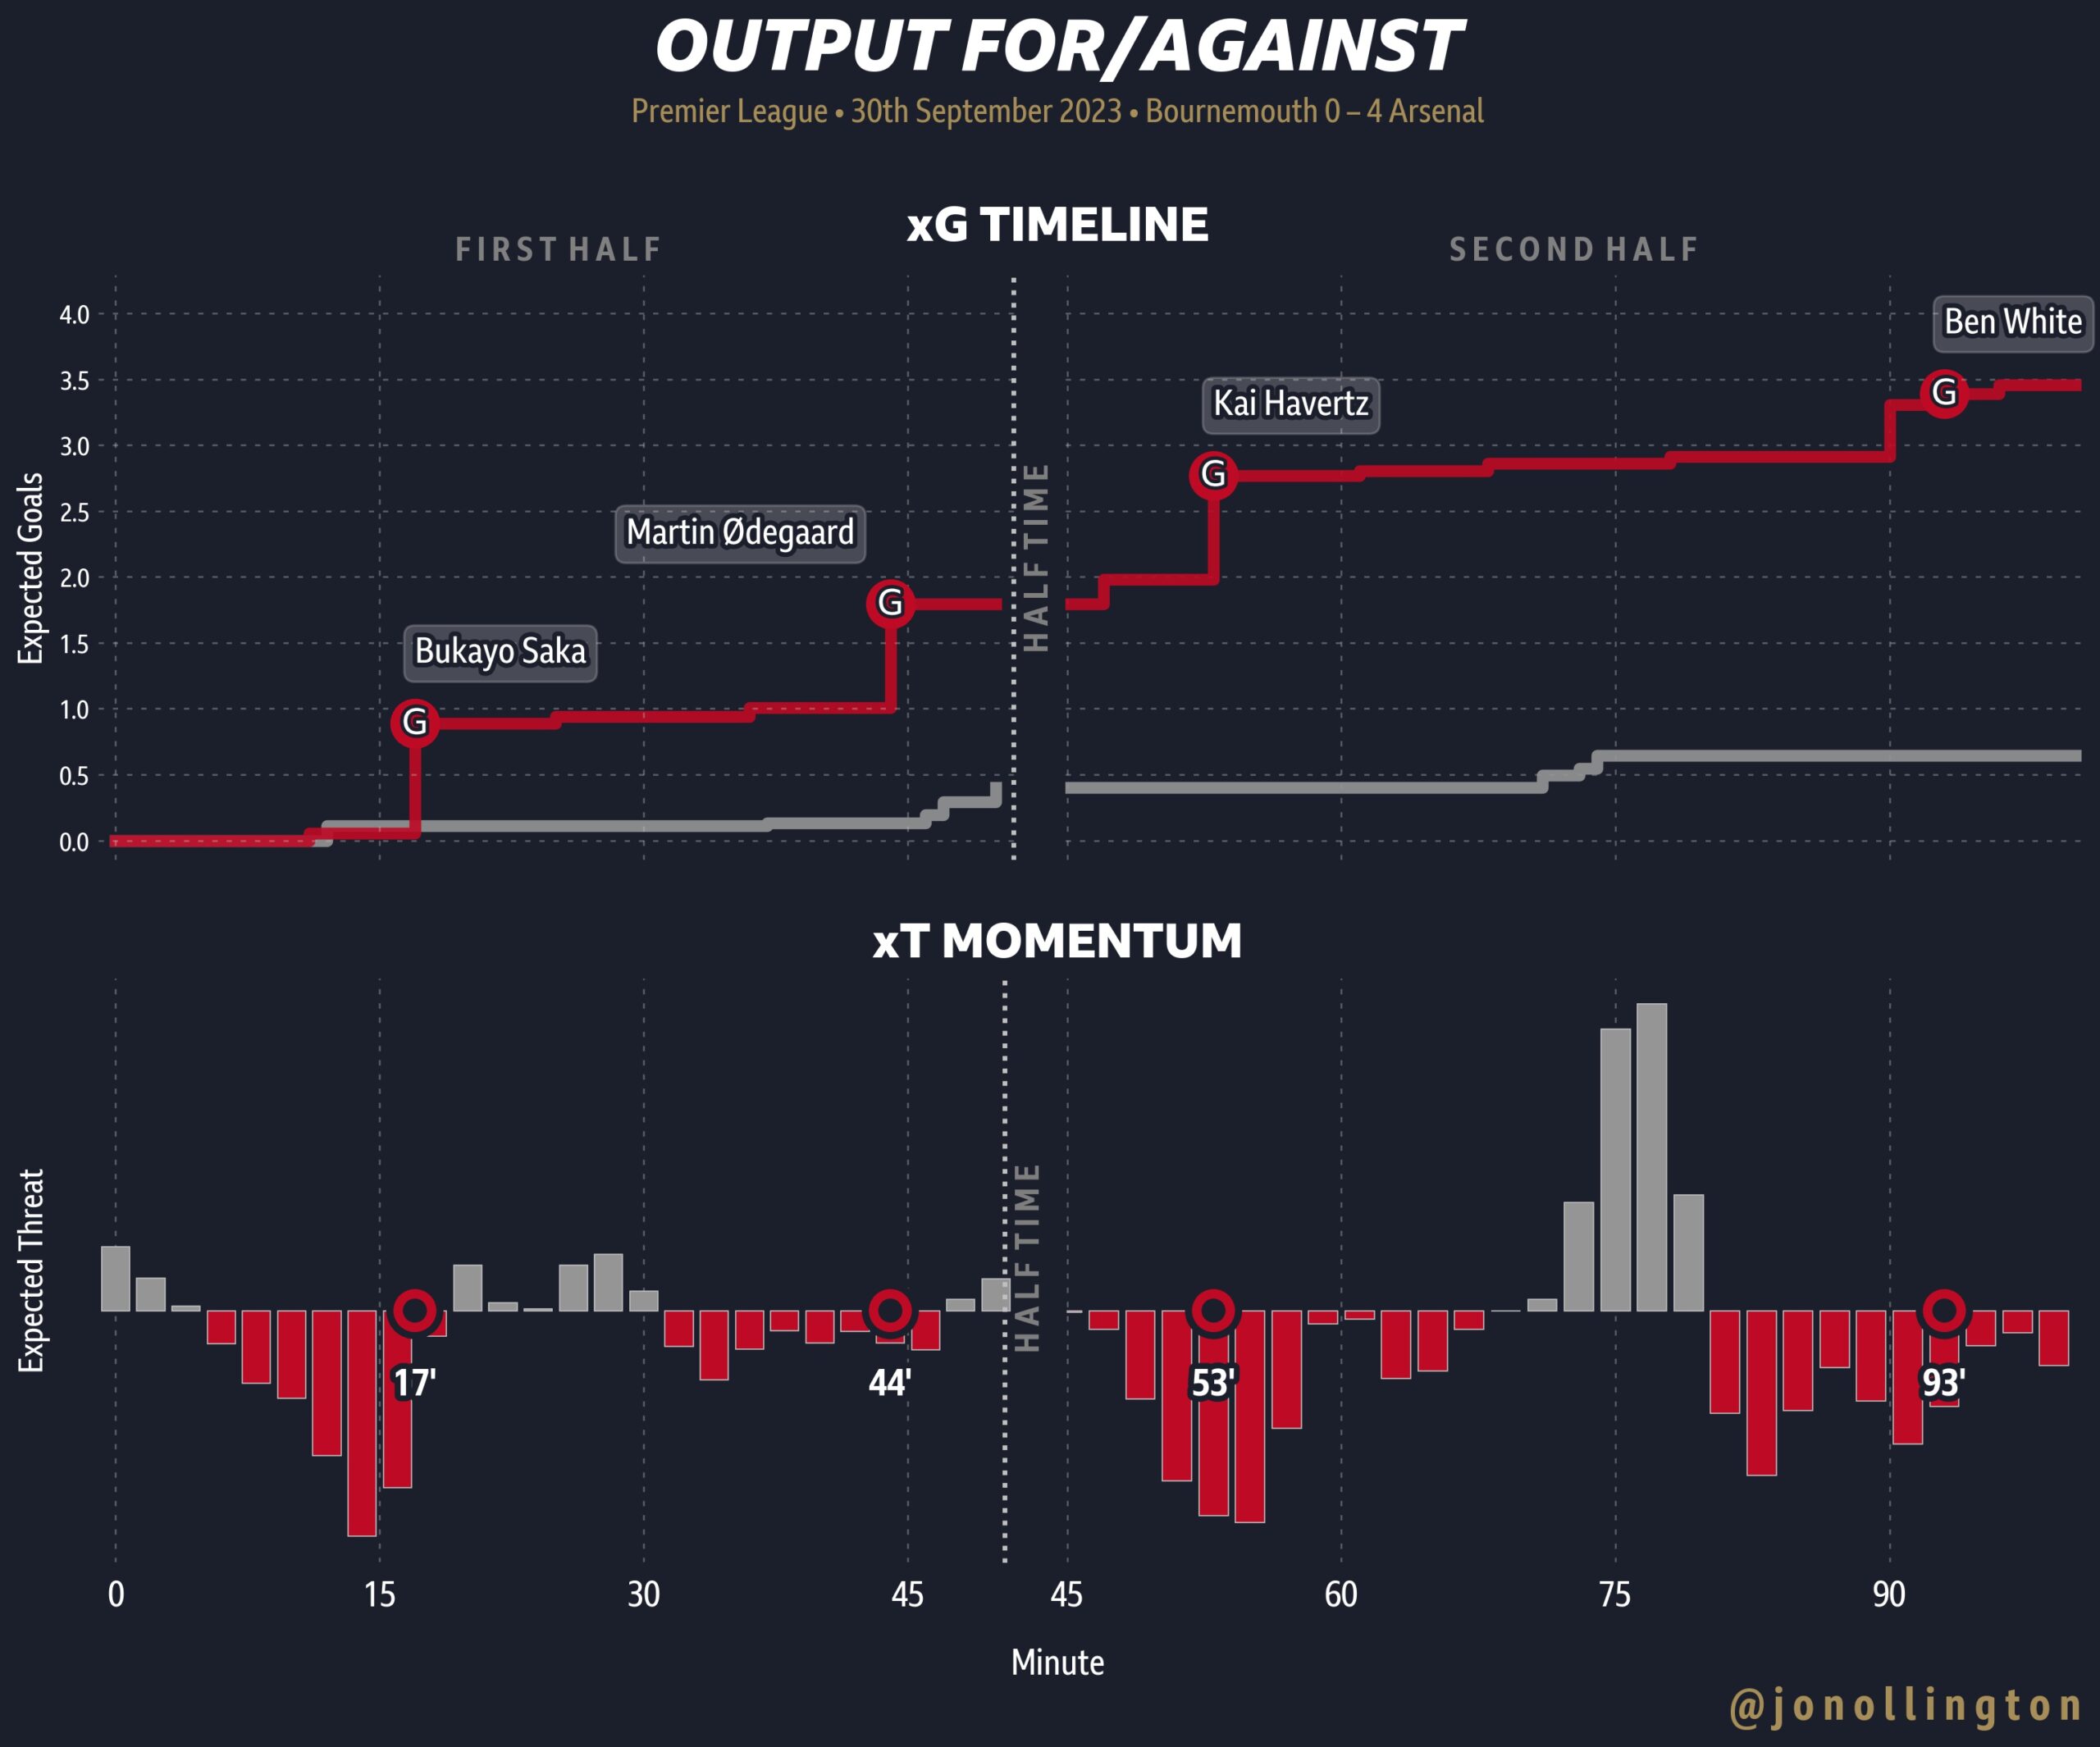
3.46 – Arsenal achieved their highest expected goals (xG) of the season at 3.46. Their non-penalty expected goals (npxG) of 1.9 is the third-highest so far this season.
35 – Arsenal recorded 35 touches in Bournemouth’s box, which ranks as the 3rd highest so far this campaign. Saka and Jesus topped the list with 7 touches each.
15 – Arsenal attempted 15 shots, including 2 being penalties. Of the 13 shots from open-play, 12 were inside the box, and 46% found the target.
6 – Martin Ødegaard registered 6 shot creating actions (1st overall).
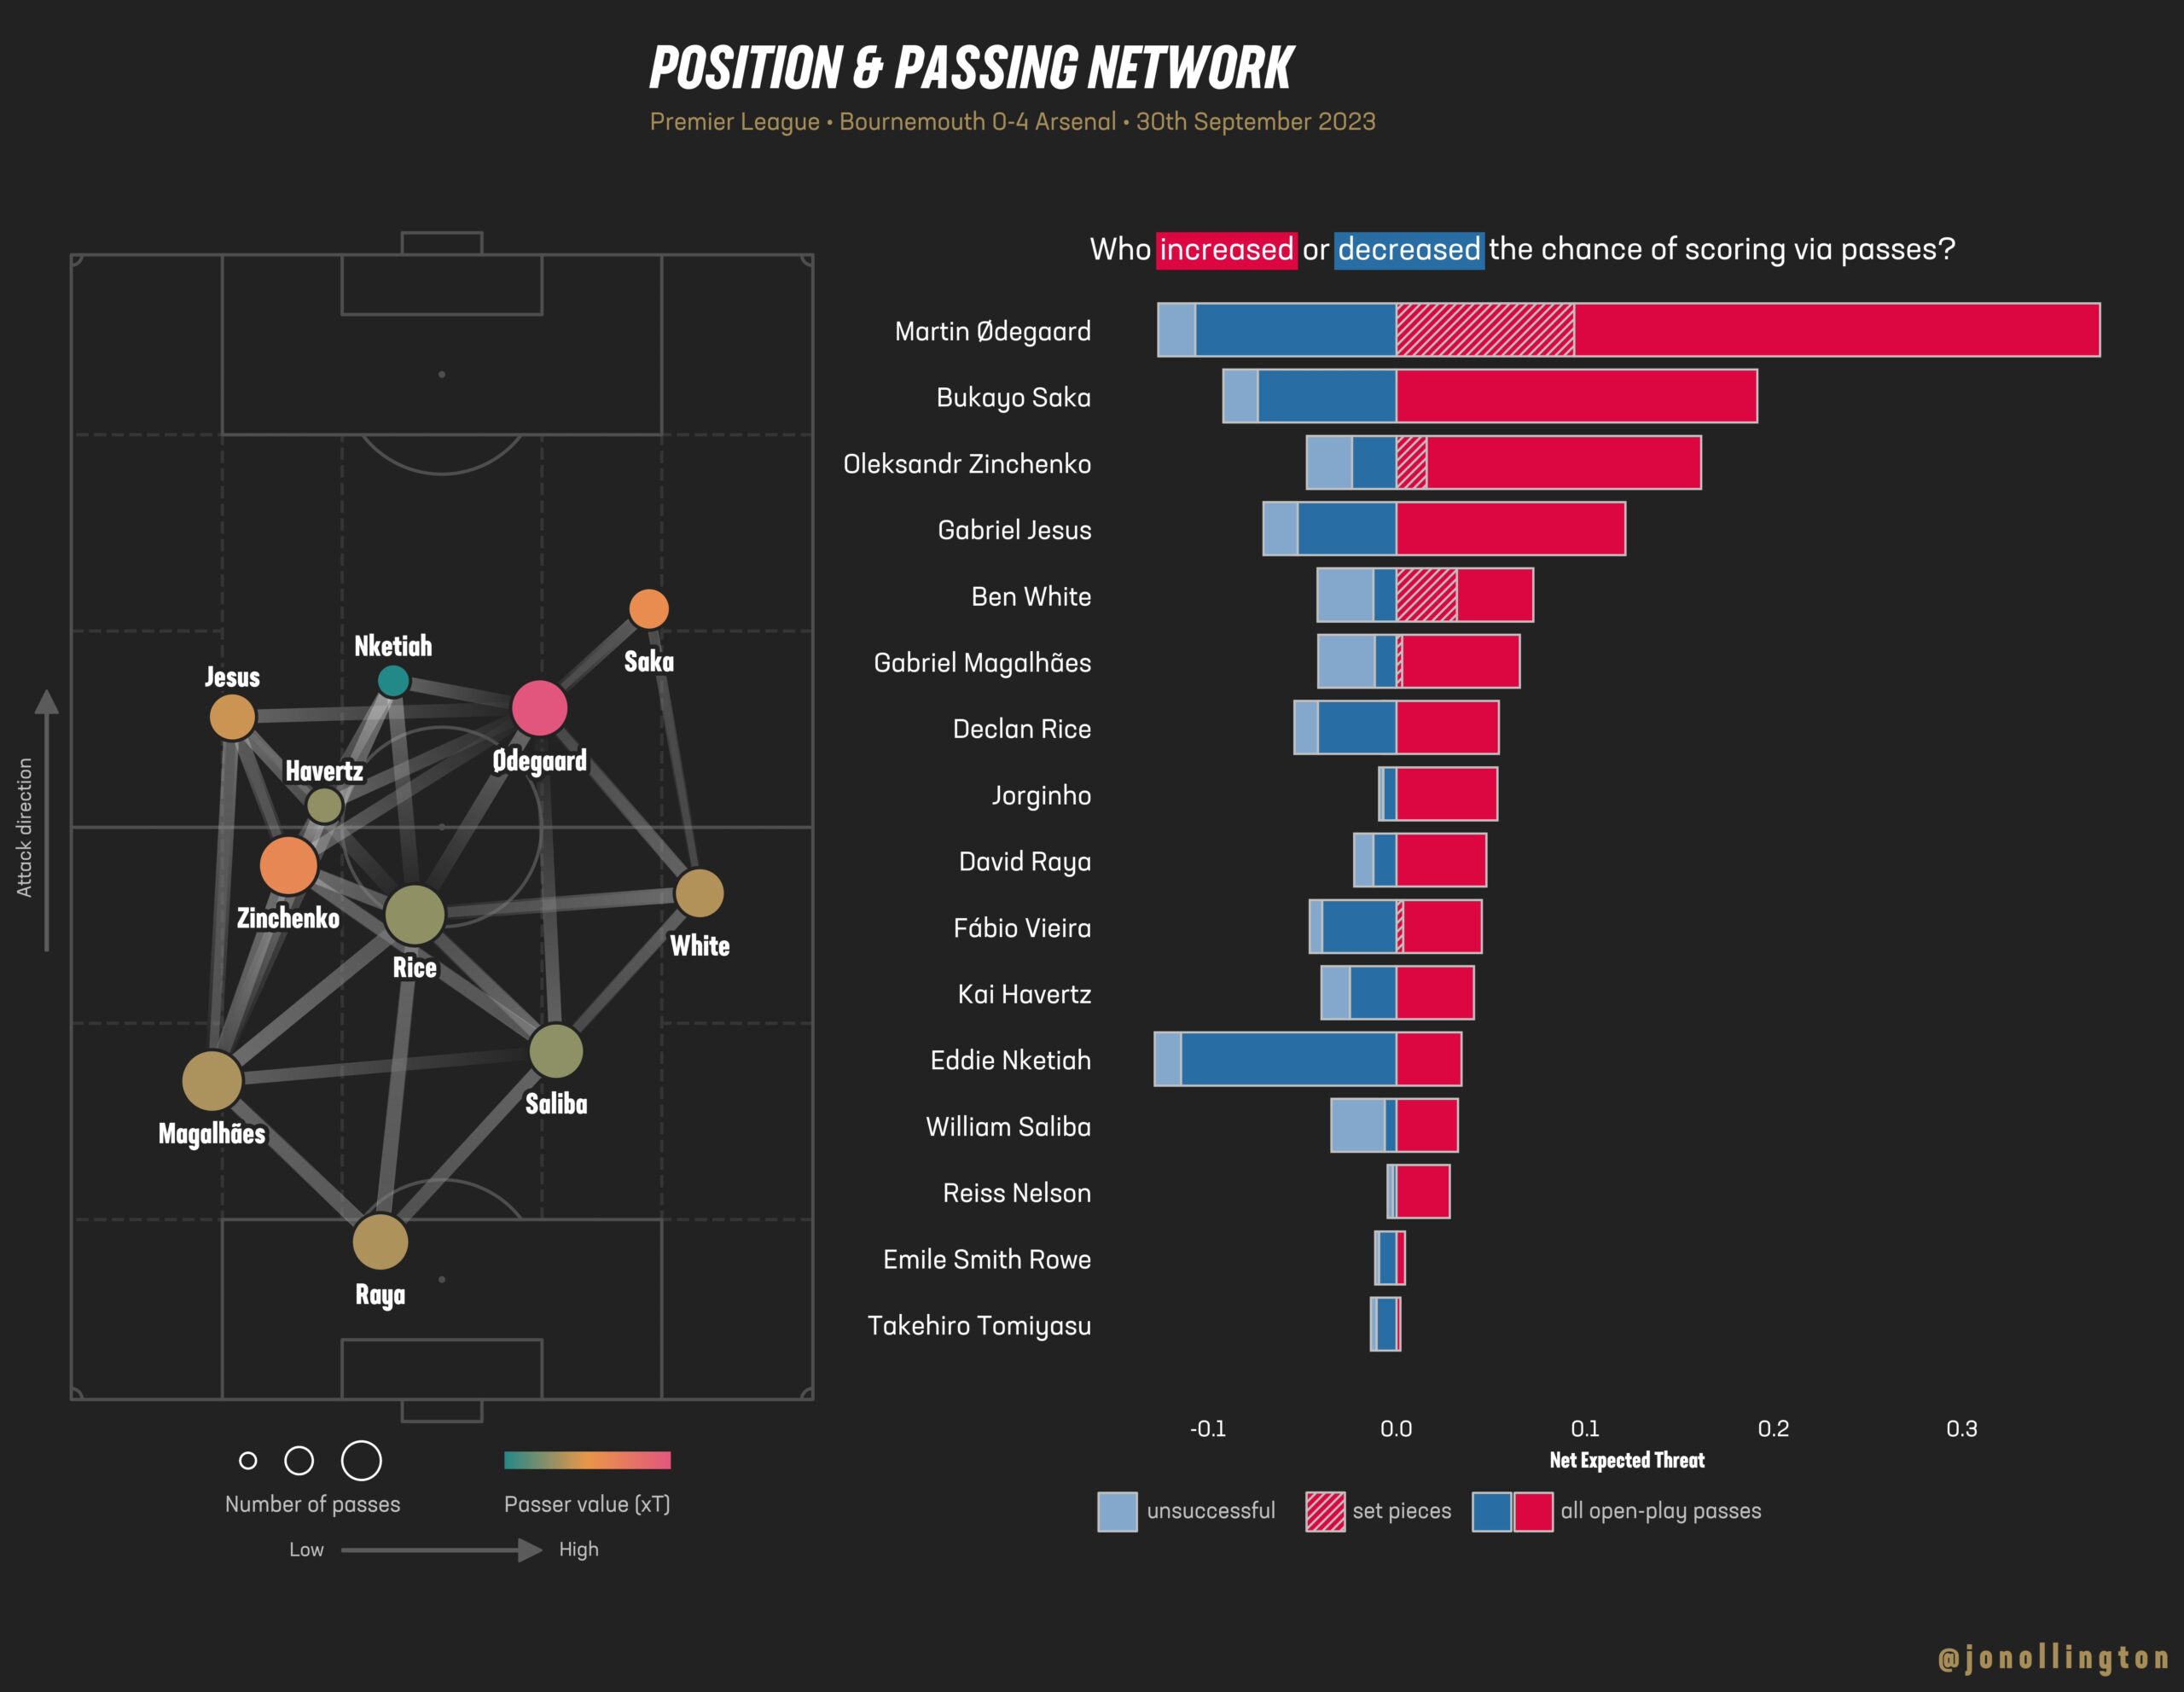
60 – Oleksandr Zinchenko had the highest number of passes among Arsenal players, attempting 66 and completing 60 (91%). As well as recording the most touches (78), the highest number of carries (55), and the highest number of progressive passes among his teammates (5), ranking second overall in the match. Defensively, the Ukrainian delivered a strong performance in terms of numbers, making the most successful tackles (4) and tying for the most interceptions (2) in Red and White. He also recorded 2 blocks and 7 recoveries.
310 – No player covered more distance than Jesus (310 yards) with the ball at their feet. Additionally, he recorded 2 progressive carries, 2 carries into the opposition penalty area (joint 1st with Eddie), and completed 75% of his 4 attempted dribbles.
55 – Touches of the ball by David Raya. Only two Bournemouth players touched the ball more than the Arsenal keeper.
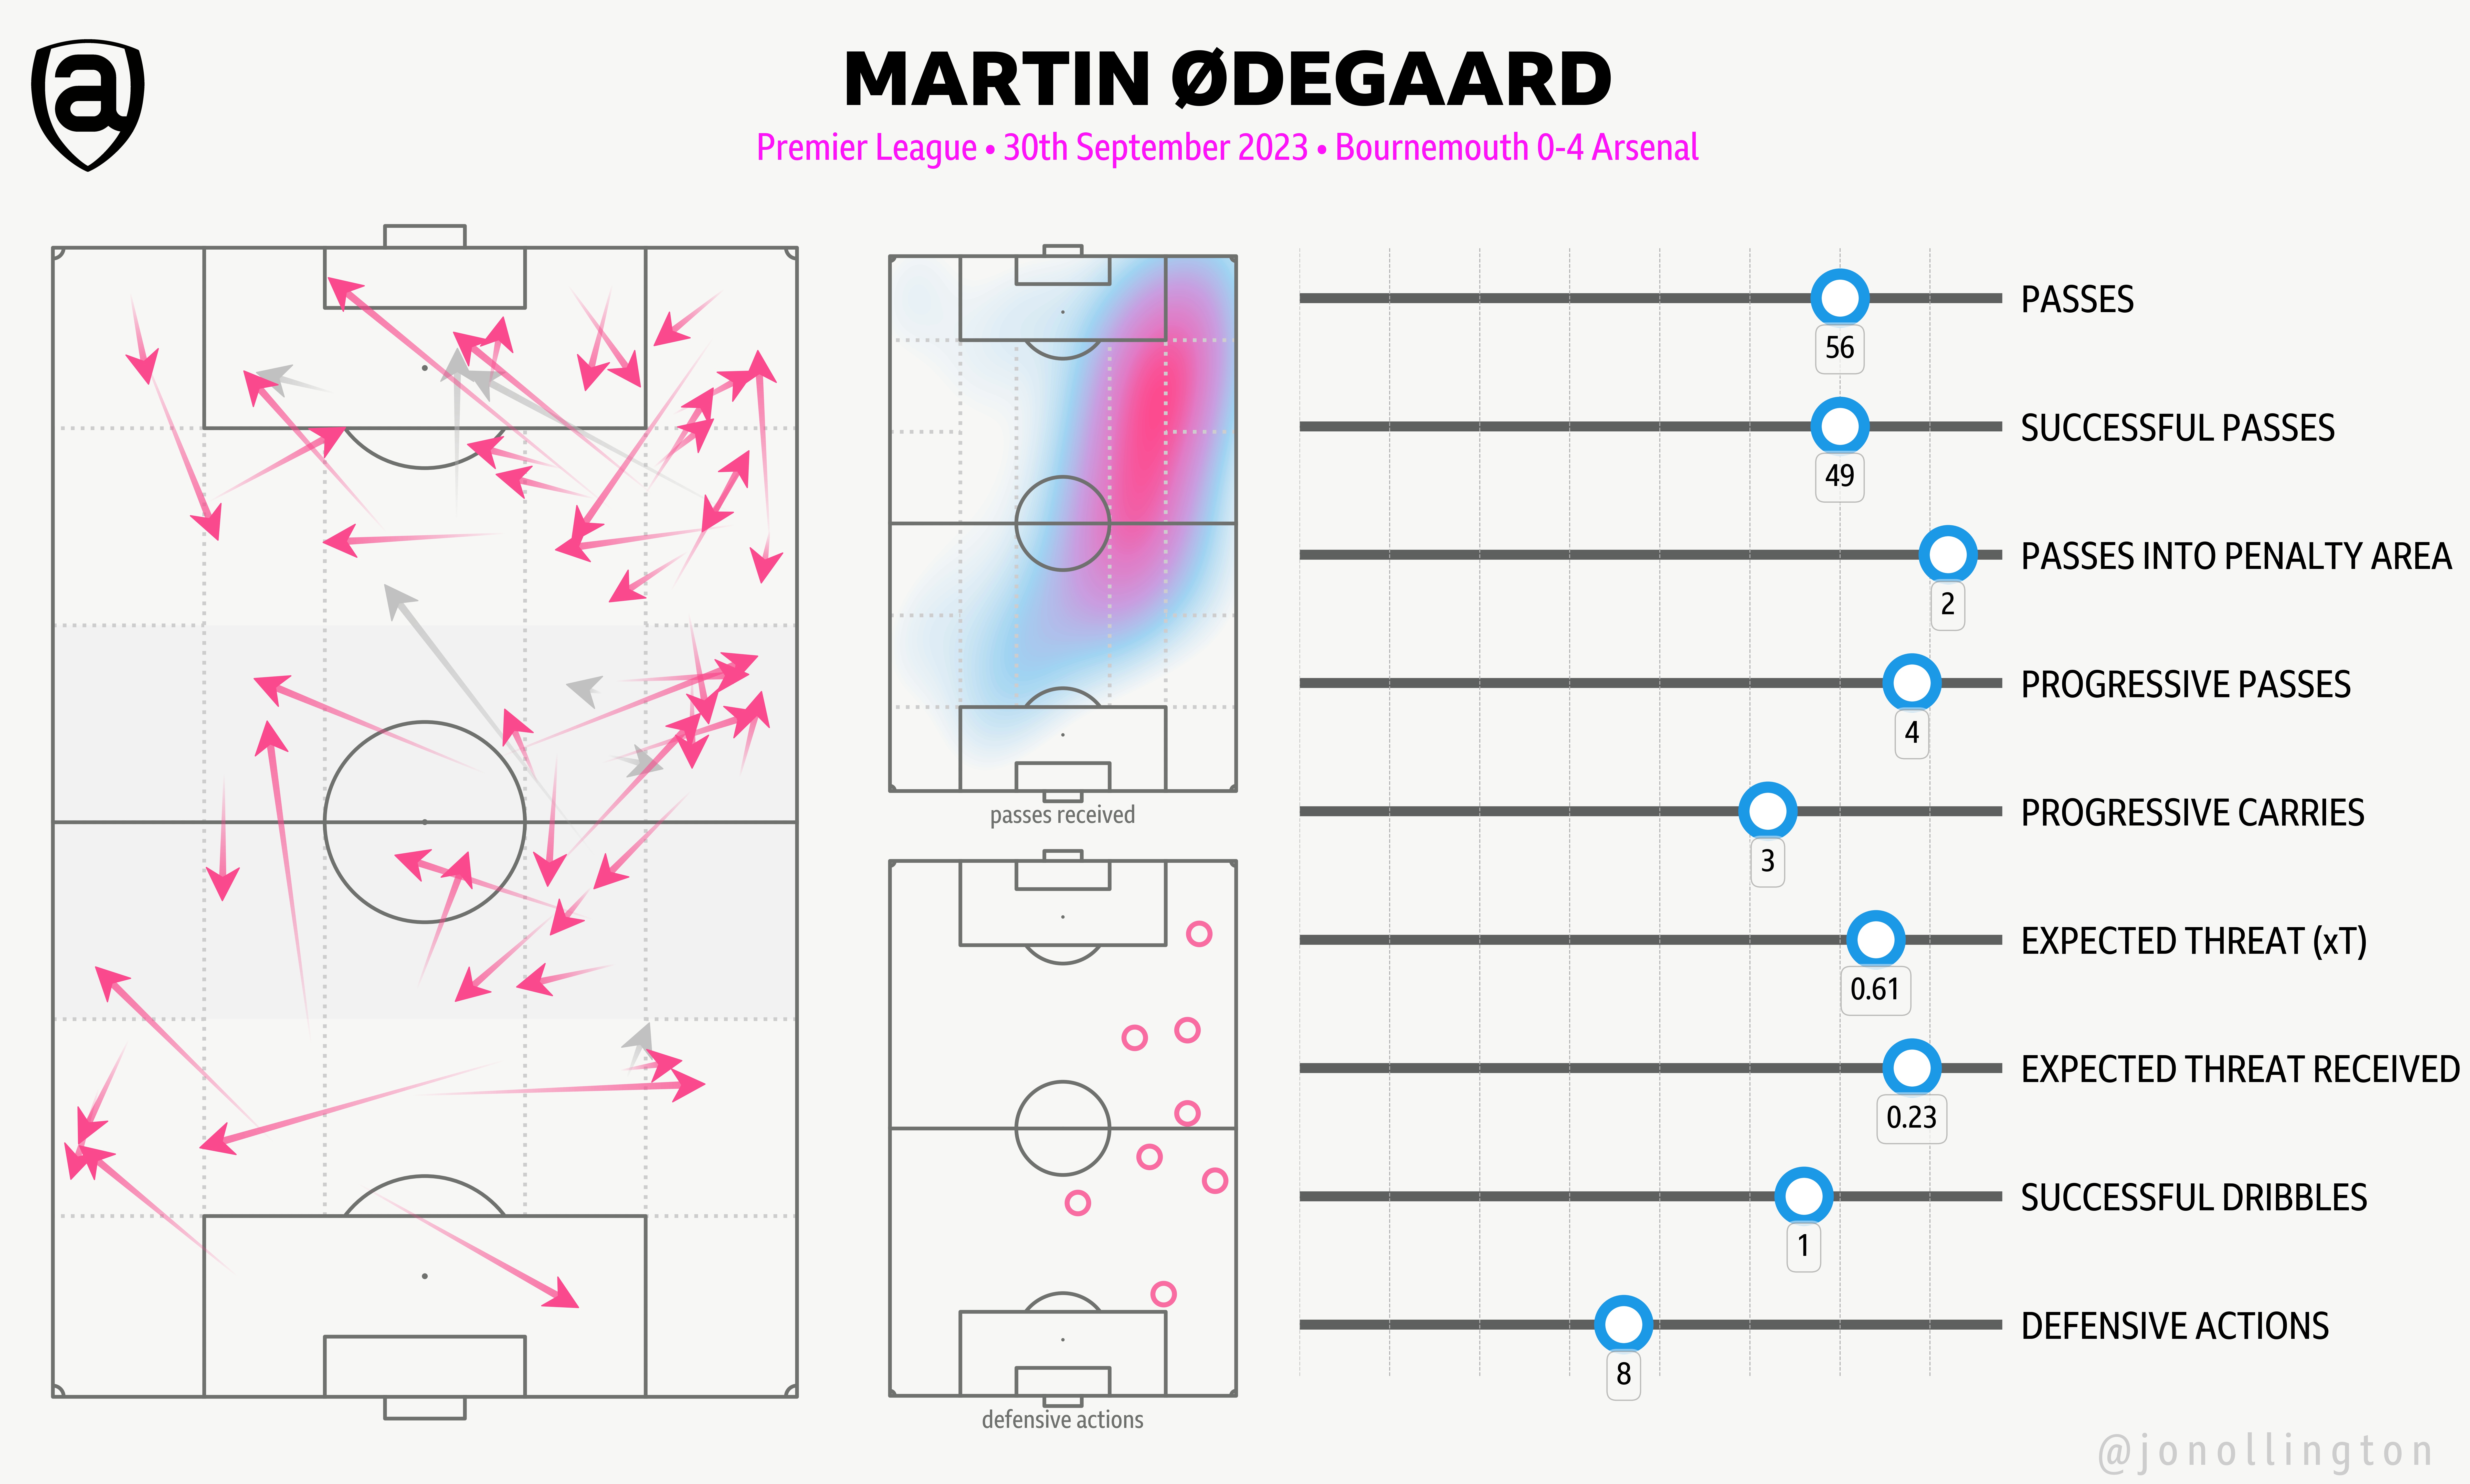
MARTIN ØDEGAARD’S GAME BY NUMBERS
1 goal, 1 assist, 0.79 xG, 71 touches, 49/56 (88%) accurate passes, 3 key passes, 2/3 accurate crosses, 2 big chances created, 2 tackles, 1 block, 6 shot creating actions and 100% take-ons completed.
The captain, who was well below his best during the second half against Spurs, was back to bossing the Premier League and put in a performance that typified his ability. Martin Ødegaard had a hand in every goal and worked tirelessly from the first minute until the last.
—
We remain unbeaten this season with 7 wins in 9 games, including 4 clean sheets. The win at Bournemouth has also maintained our perfect record away from home. Yet, just a week ago, it seemed like the title was City’s to lose. However, if we beat a Manchester City side without Rodri next Sunday at The Emirates, we’ll go above them in the table.
Follow me on Twitter @jonollington
Sources: Opta, fbref, @Orbinho twitter feed


As dominant and easy as it looked.
I mean, im as upbeat as anyone else about City dropping points but if Jorginho hadn’t literally gifted a goal to Spurs we would already be top.
These are the margins we have to get on top of.
How could Eddie complete 75% of his 6 attempted dribbles?
I mean, literally, 75% of 6 is 4.5
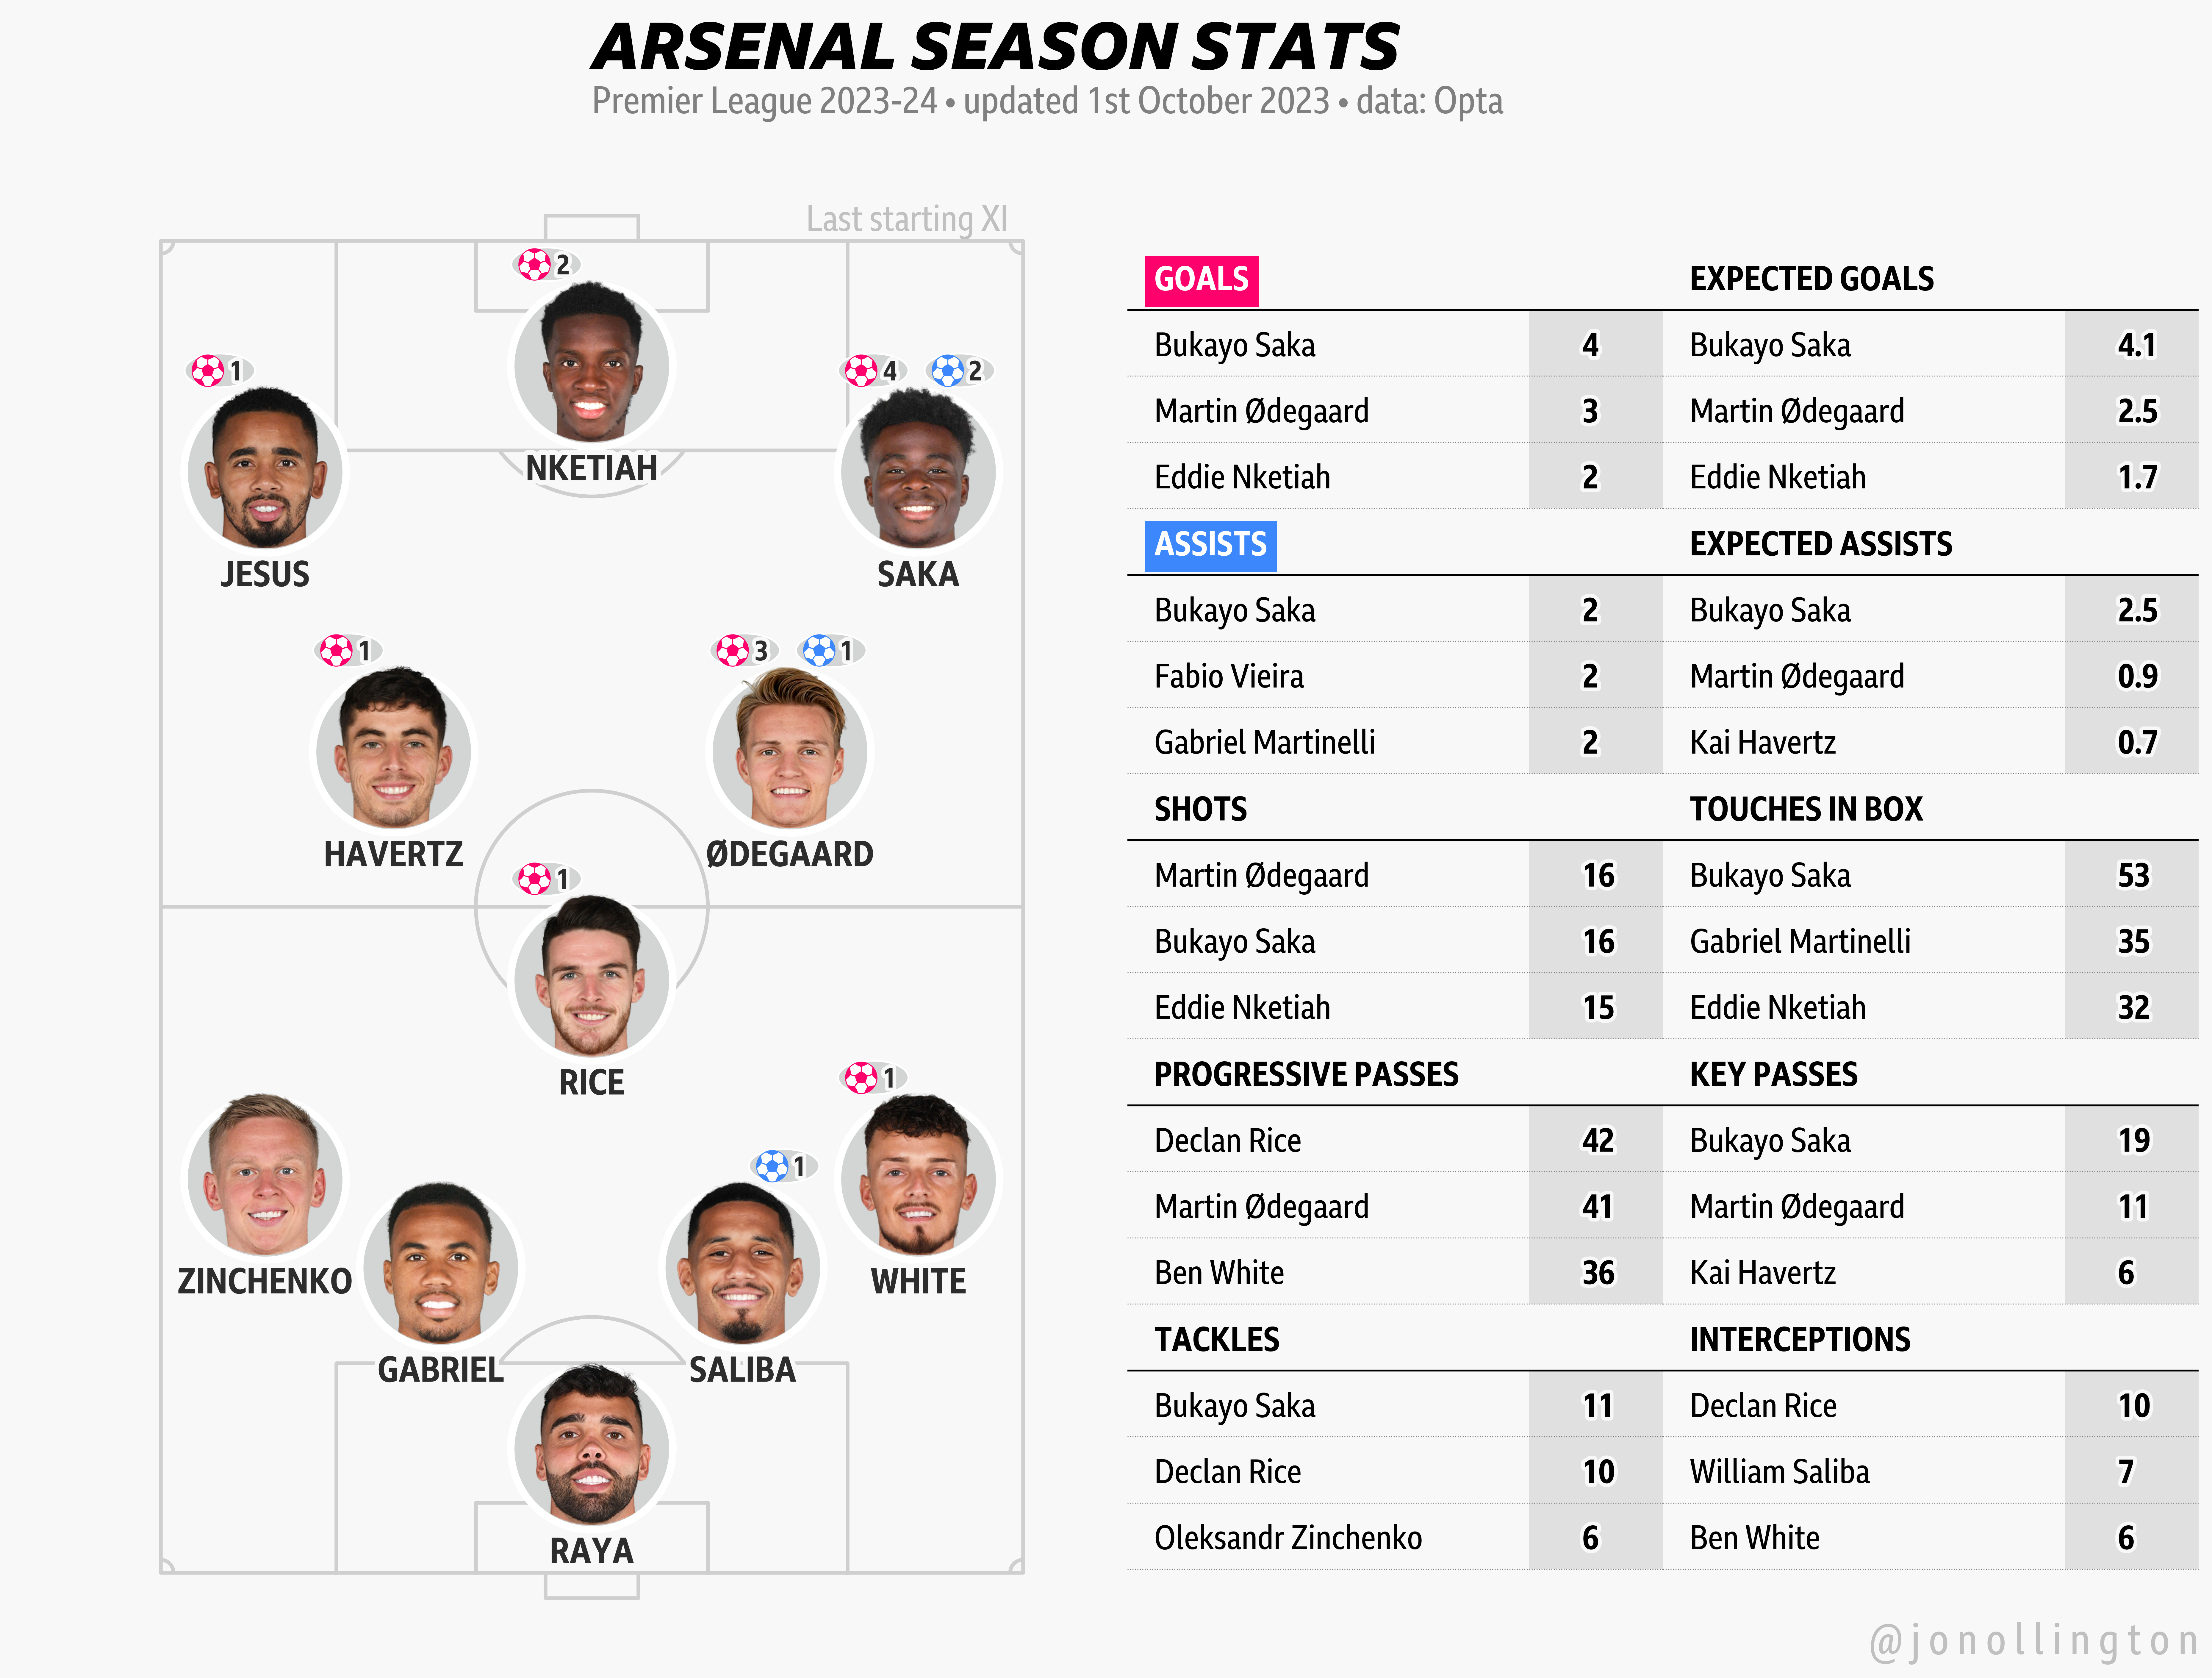
Saka is the first on everything! Including tackles! This guy is wonderful.
Do we really still record distance carried in yards?
I hope the ball’s inflation is still measured in PSI. To be fair, there is something funny about reading the laws, which all list metric measurements that seem bizarrely arbitrary (the goal is 7.32 metres wide and 2.44 m high, many dimensions are 9.15 m). Though, at least, the corner arc is defined as 1 m, not (as it logically “should” be), .915 m.
What a great update on “By the numbers”! Bravo!
I’d like some clarification on how one determines whether a player increased or decreased the chance of scoring via passes. Is it direction of the pass? Eddie, in that case, would decrease the chance by returning a forward pass when his back was to goal. Does it depend on how soon after a pass a goal is scored?
I noticed eddie decreases our chances of scoring consistently in the position and passing network.