

Note: You can open large versions of each image in a new tab by clicking.
Arsenal played Wolves at the beginning of February – gave away a penalty that saw David Luiz sent off, and threw away 3 points due to an individual error. Between that fixture and yesterday’s North London Derby, The Gunners have played a further eight times and gifted their opponents a goal in five of those encounters as a result of further individual errors.
Tottenham came into Sunday’s derby having won their last five in a row, and were favoured to pick up only their second win at The Emirates in the Premier League era.
Yet it was Arsenal who took the game to their opponents – they pressed high and snapped into tackles. Emile Smith Rowe was denied by the crossbar early on, and the left flank was a constant menace for Tottenham as he and Kieran Tierney continually found dangerous positions, and seemingly took it in turns to deliver a number of tantalising balls.
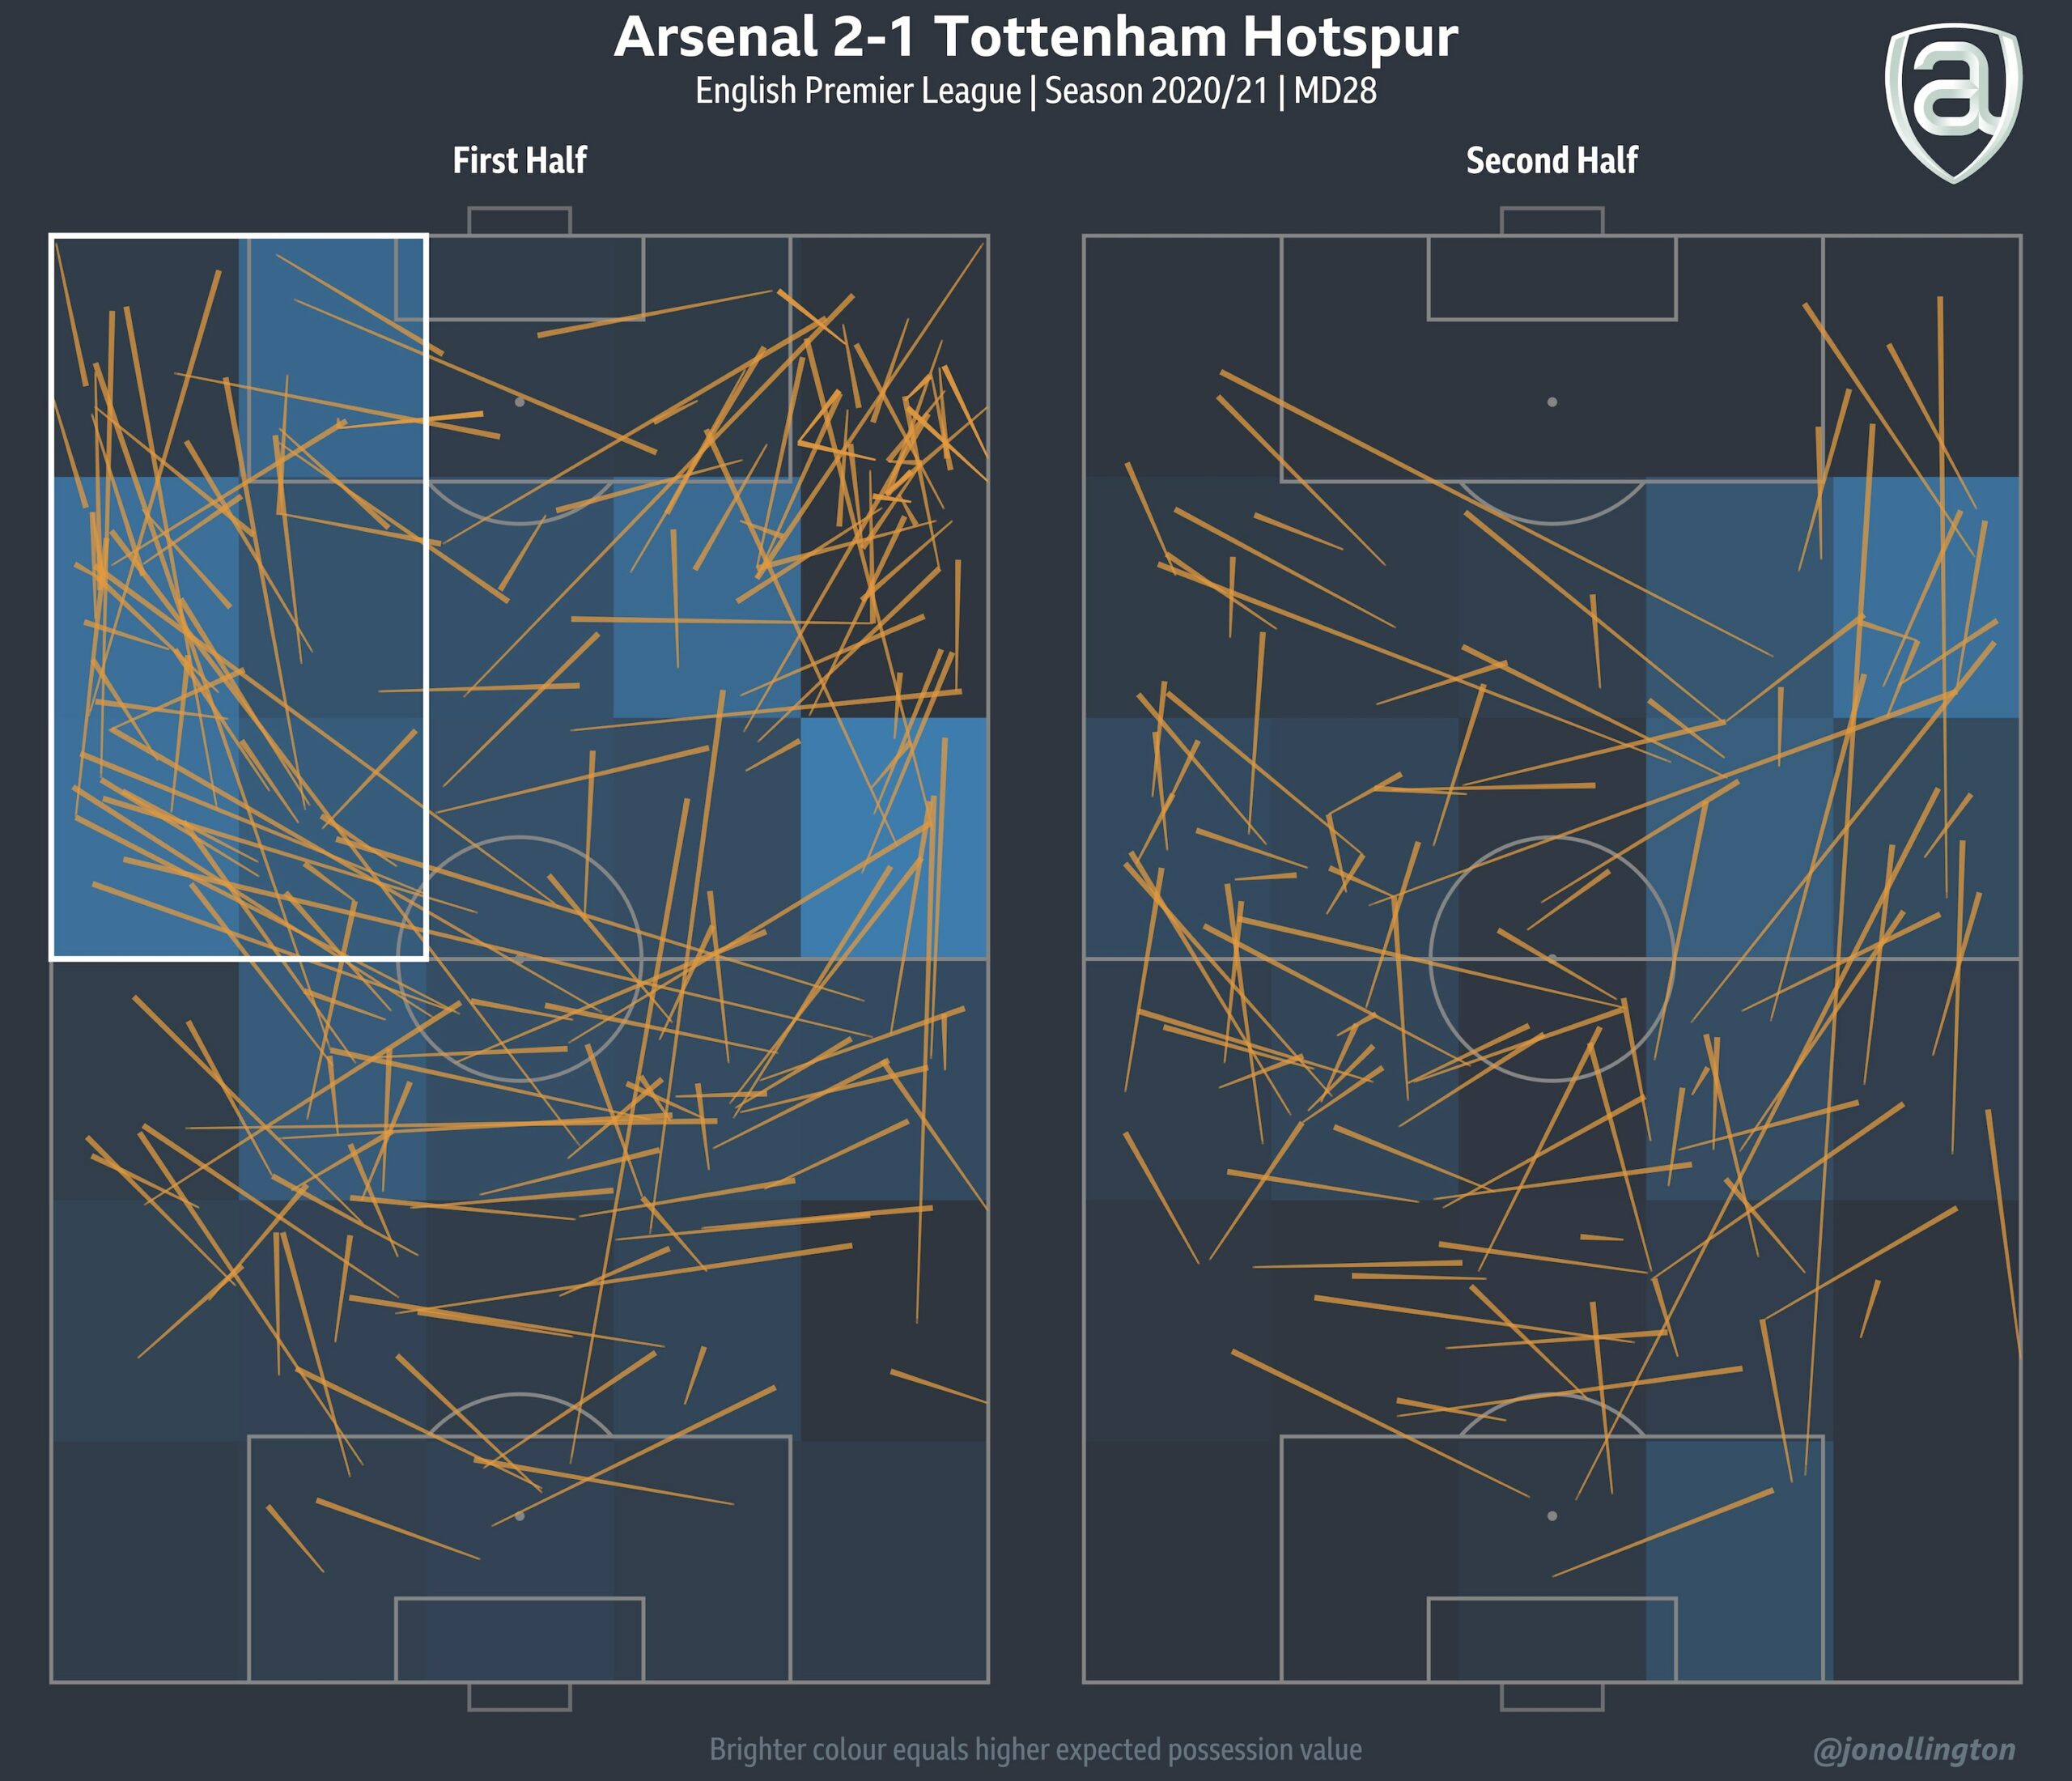 Above is Expected Value Possession shown from passes in the first and second half that highlight the success Arsenal had during the first 45 minutes down their left – the brighter area equals higher EPV.
However, Arsenal found themselves behind on the half-hour mark when Erik Lamela scored with Sp*rs’ first shot (and their only till 75 minutes), and despite it not being a result of an individual error, it was a sucker-punch that reeked of ‘here-we-go-again’.
Mikel Arteta’s team responded well – Cedric hit the post after more good work down the left-hand-side from Smith Rowe and Tierney – before Martin Odegaard finally rewarded their efforts and importantly, before Jose Mourinho had a chance to rectify anything during the break.
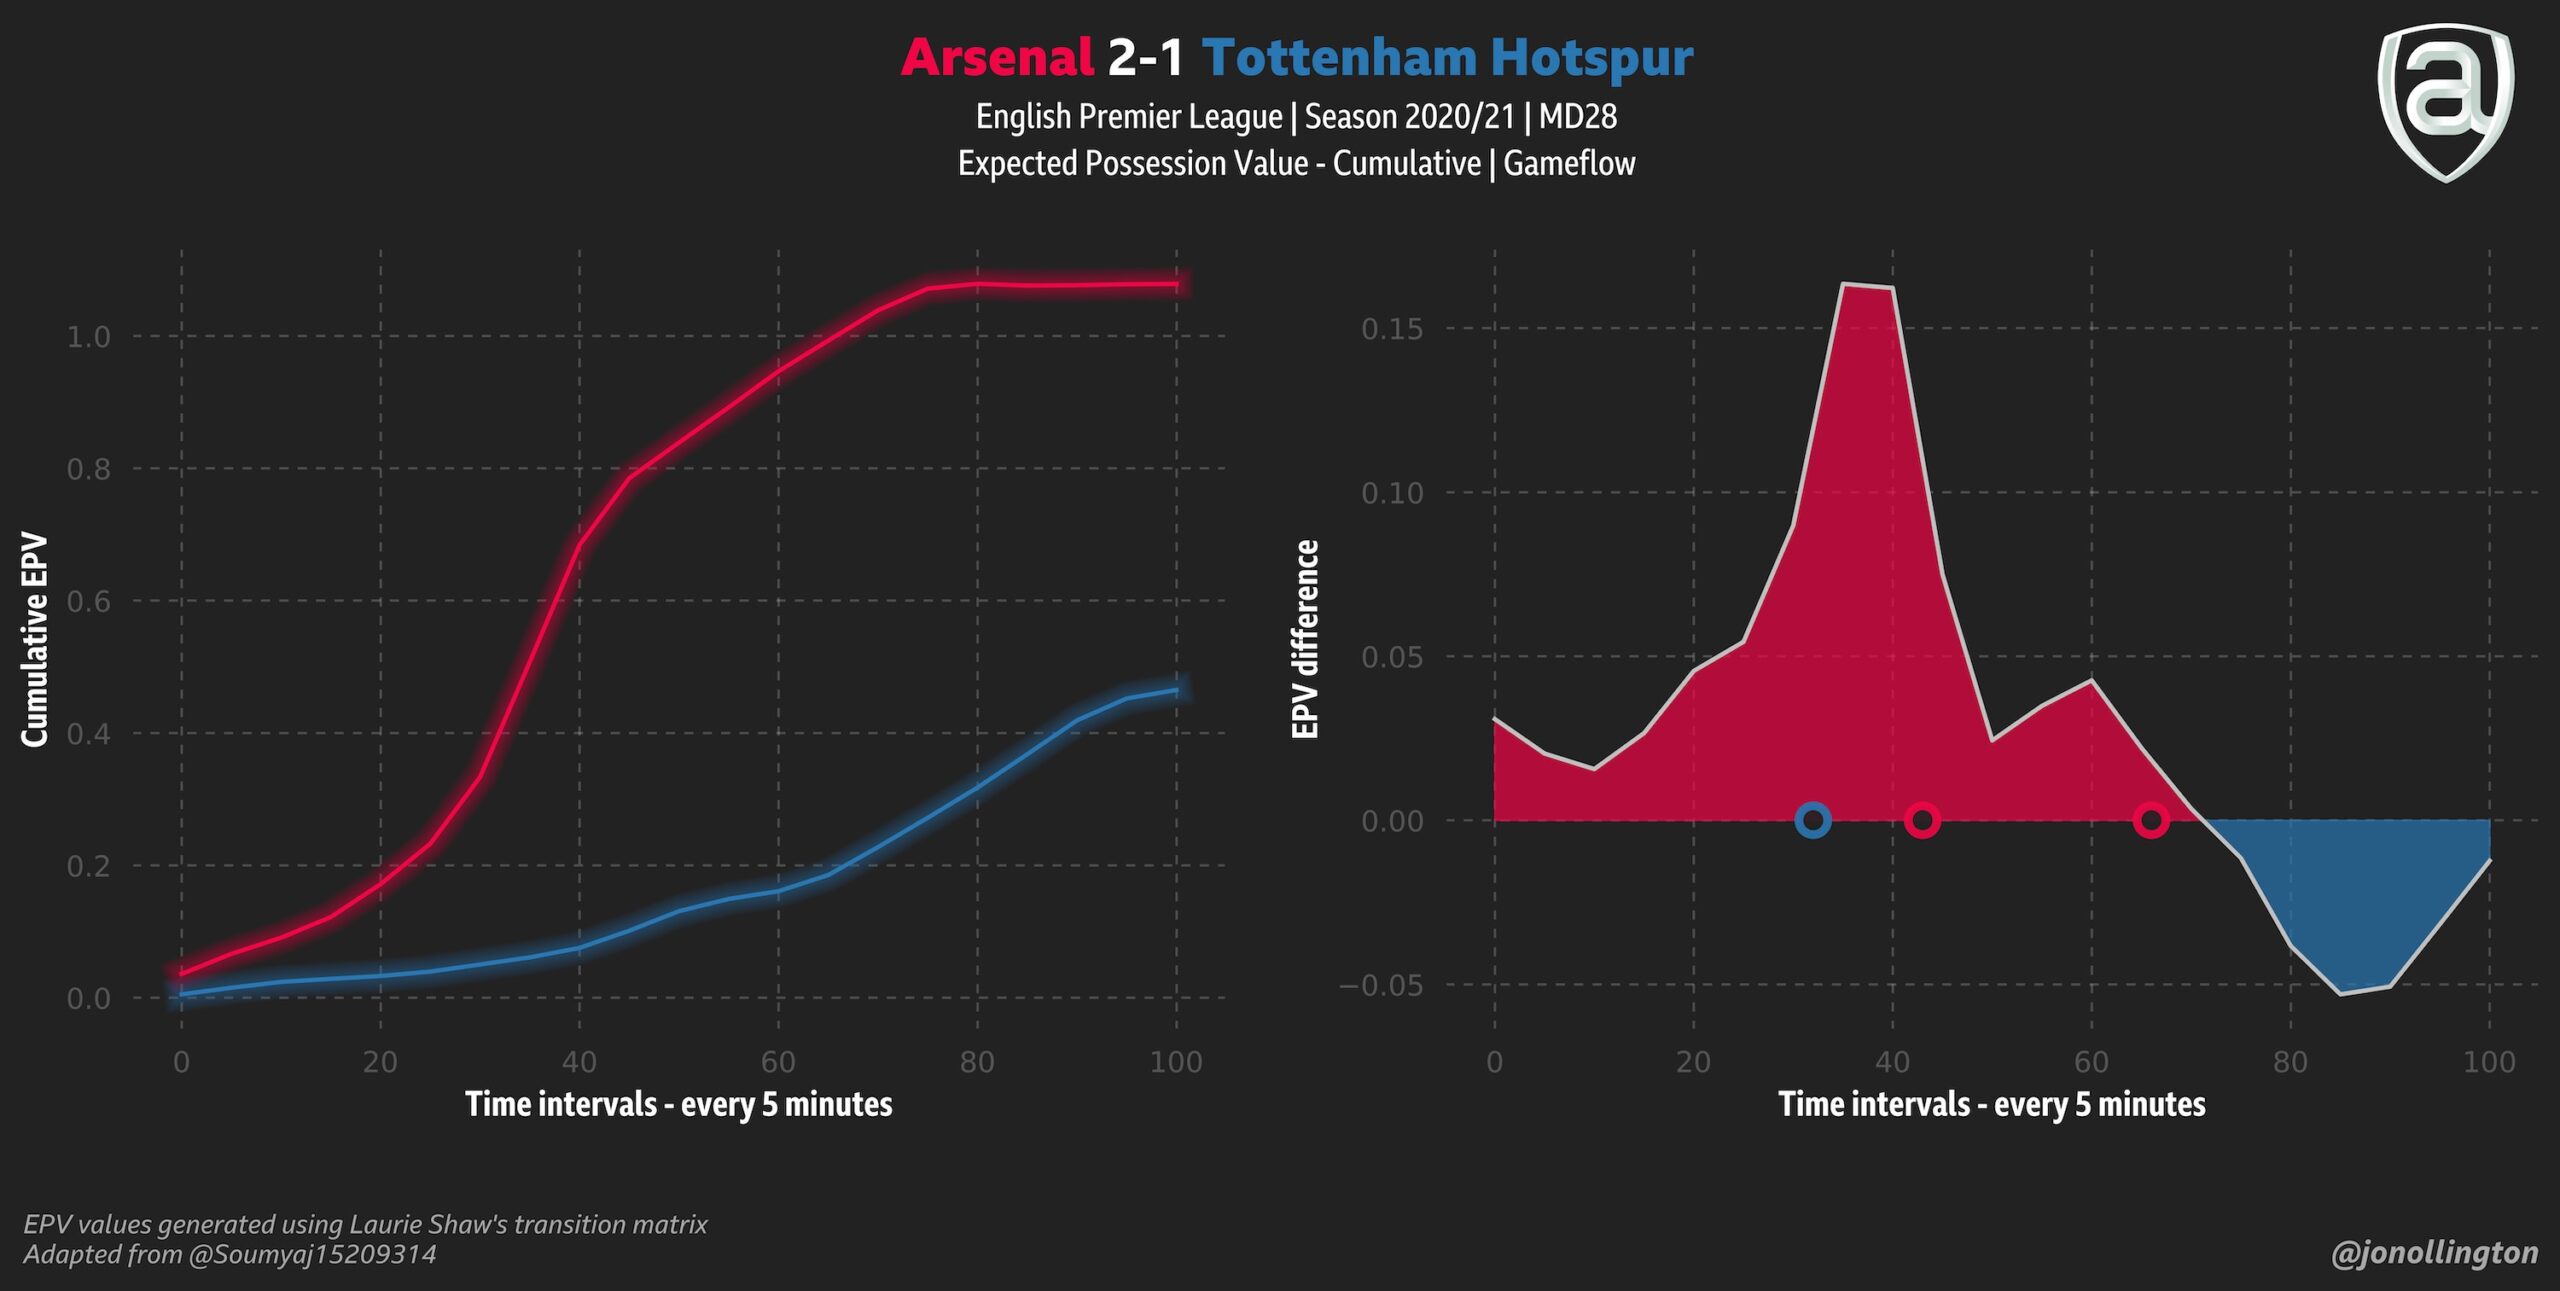 Above are the cumulative Expected Possession Value (EPV) and EPV gameflow plots that depict the probability of either team scoring from possession during Sunday’s encounter.
Possession Value looks at the area/zone of the pitch a pass is made, and what area/zone it successfully finds a teammate and quantifies the result – establishing the probability of a team scoring from an individual possession.
It also does a pretty good job of depicting a football match in graphical format. As above, Arsenal were in complete control of Sunday’s encounter until around the 75th minute. By that time, the Gunners were in the lead when Alexandre Lacazette scored from the spot after being scythed down by Davinson Sanchez and the visitors had been reduced to 10 men after Lamela’s second booking.
Mourinho’s side had to attack and Arsenal struggled to contain them as nerves crept in, but managed to hold on for a deserved 3 points and gave Mikel Arteta his first derby win.
 Above are the Possession and Field Tilt plots. Field Tilt measures the share of passes made in the attacking third.
Of all time spent in the final-third Arteta’s side amassed a whopping 72% Field Tilt – averaging a shot every 7.4 minutes. For context, Tottenham averaged a shot every 16 minutes and of those 6 attempts, 83% came after going behind.
 Above is the pass and position network until the second sub at 64 minutes and individual net possession value ratings from Sunday’s 2-1 win..
For anyone with an eagle eye – I’ve included up till the second substitution to give a better reflection of Arsenal’s pass and position network, but please note, Saka was replaced for Nicolas Pepe at half-time.
Not surprisingly, Kieran Tierney, Emile Smith Rowe and Martin Odegaard all produced the highest progressive Possession Values on the day, but they also played a number of regressive passes to recycle possession that impacted their net value – however, their performance – especially in the first half – was exceptional.
Smith Rowe created more shots than the entire Sp*rs team combined (3), as Arteta intelligently targeted their right-hand-side with an out-of-position Matt Doherty receiving zero help from winger Gareth Bale.
Tierney picked up his third Premier League assist of the season and Odegaard grabbed his second goal in two games.
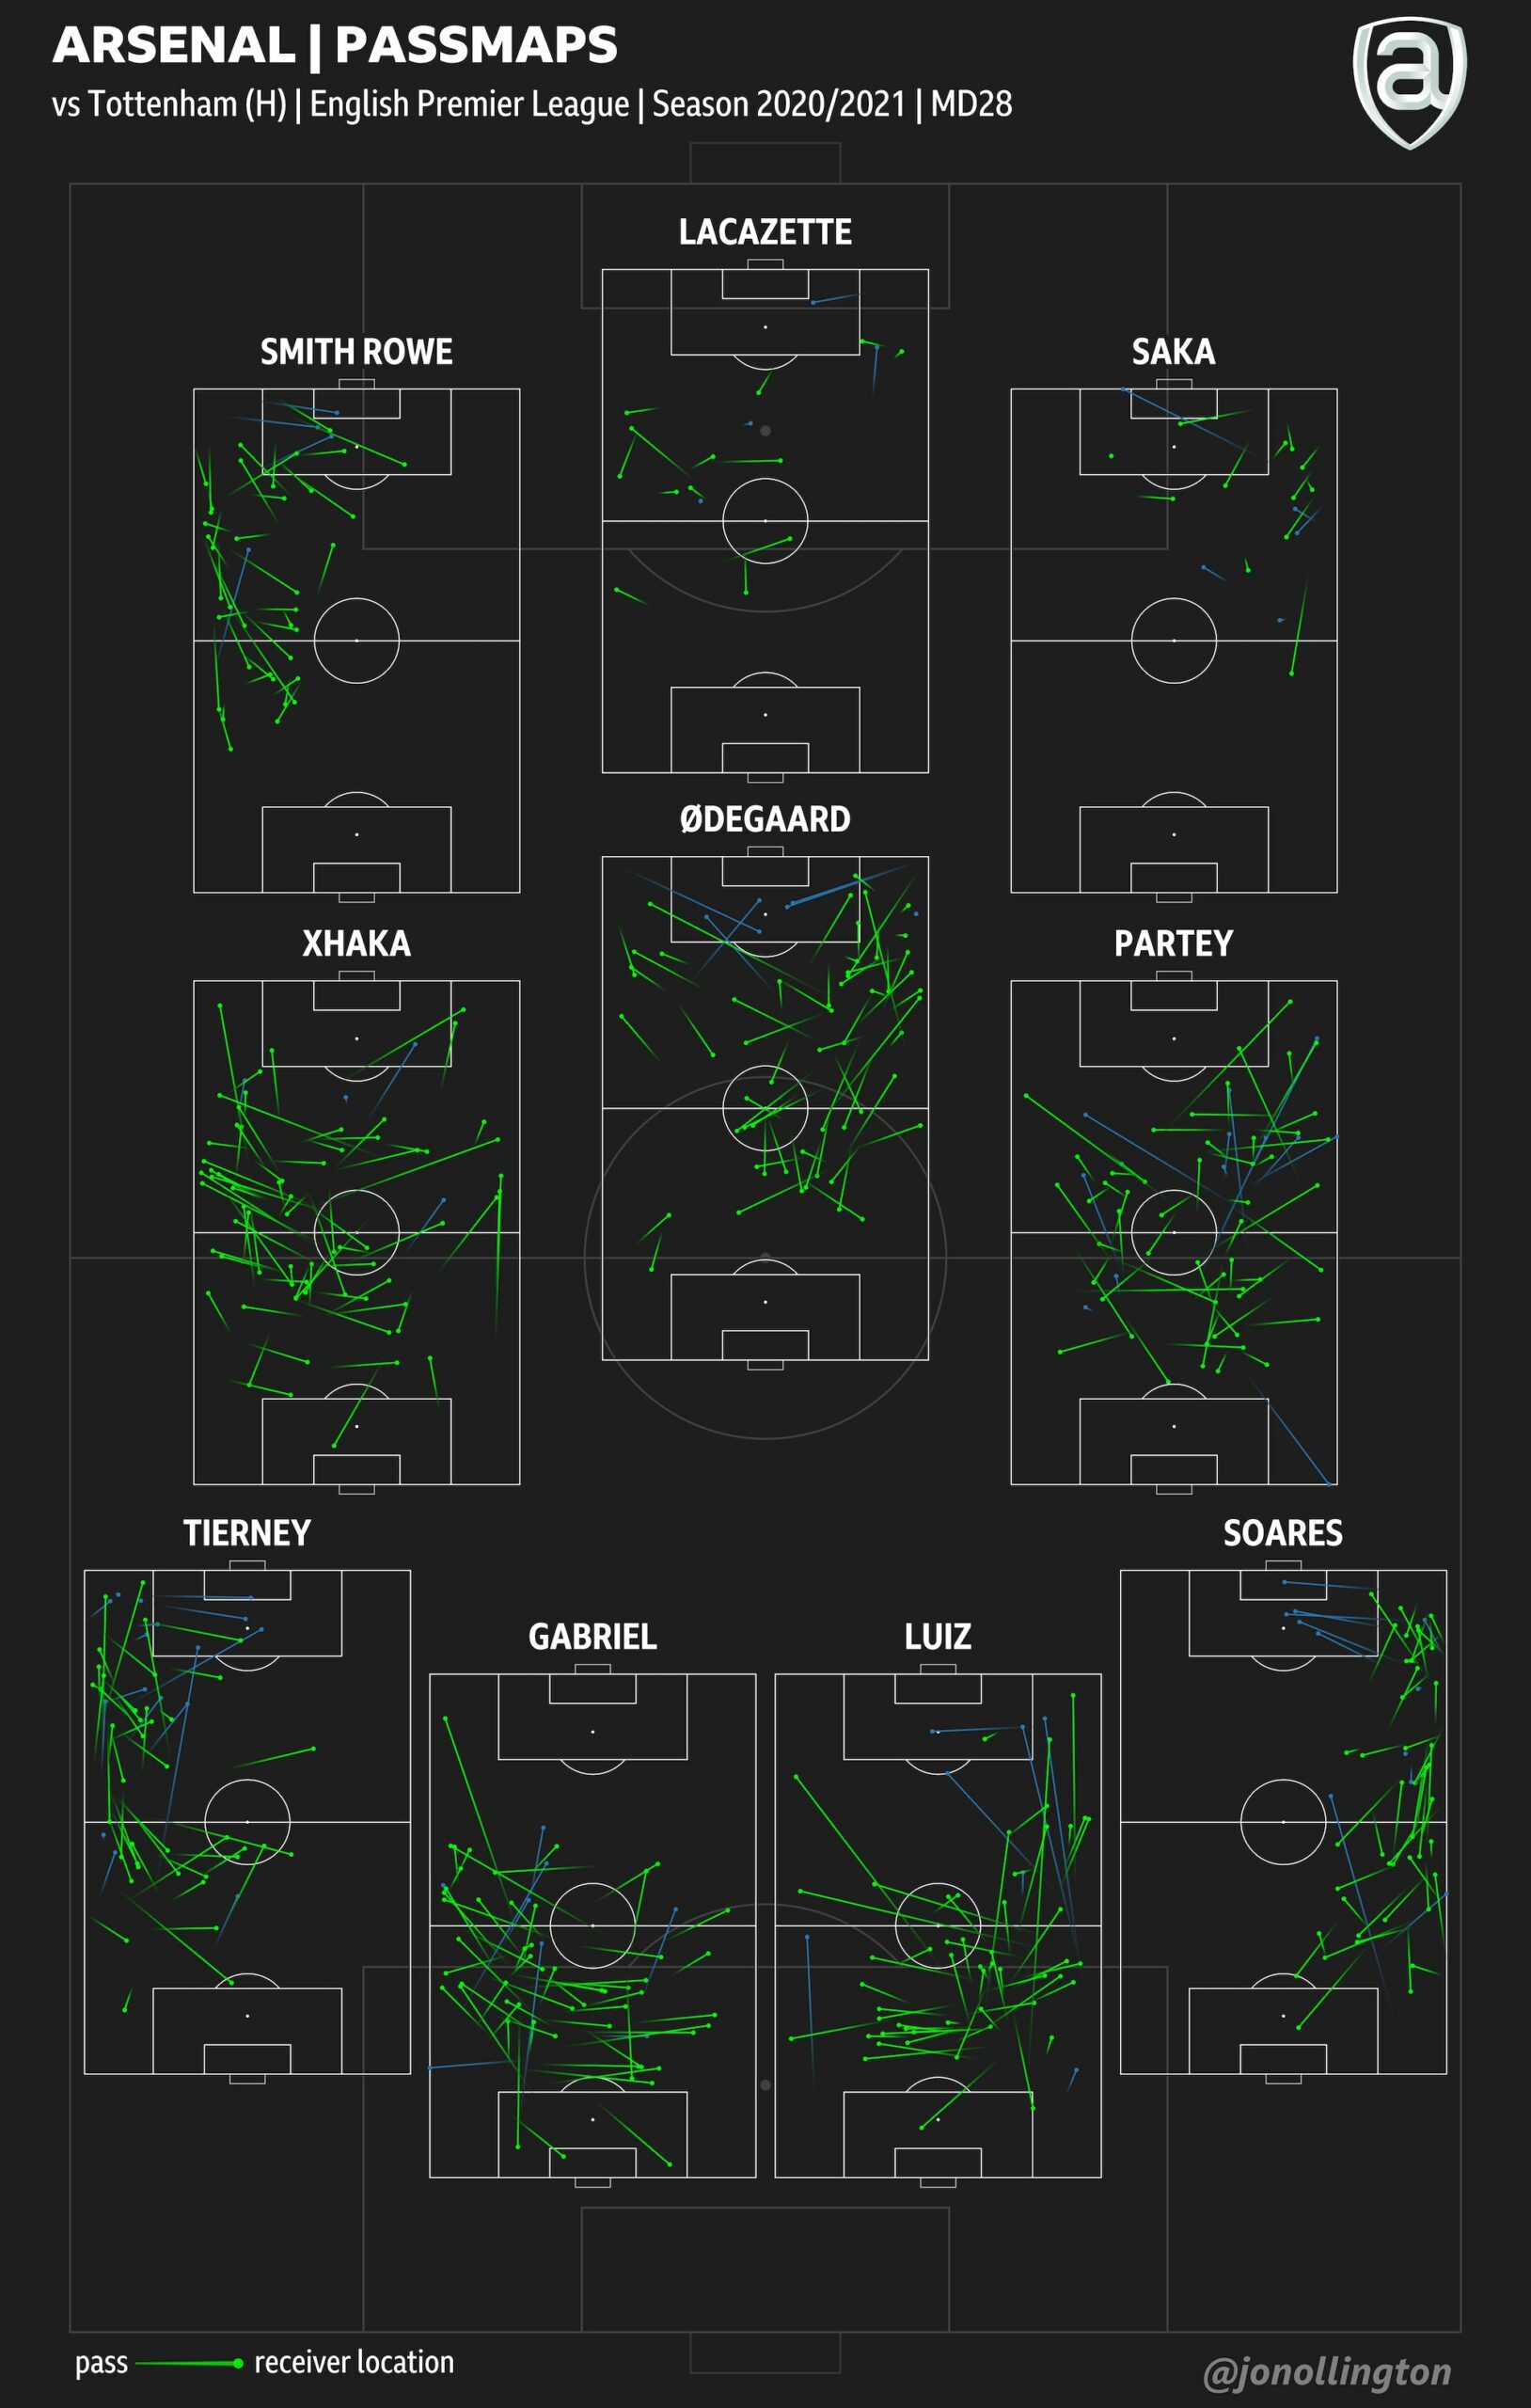 Above are the individual passmaps for Arsenal’s starting XI – Green are successful | blue are unsuccessful
Martin Odegaard ranked 1st for Passes into the Penalty Area (2), 2nd for Progressive Passes (5) and applied more Pressures in the Final 3rd than anyone else on the pitch (12). In the biggest week of Arsenal’s season, the on-loan Norwegian has produced two Man of the Match performances and is getting better and better with every game.
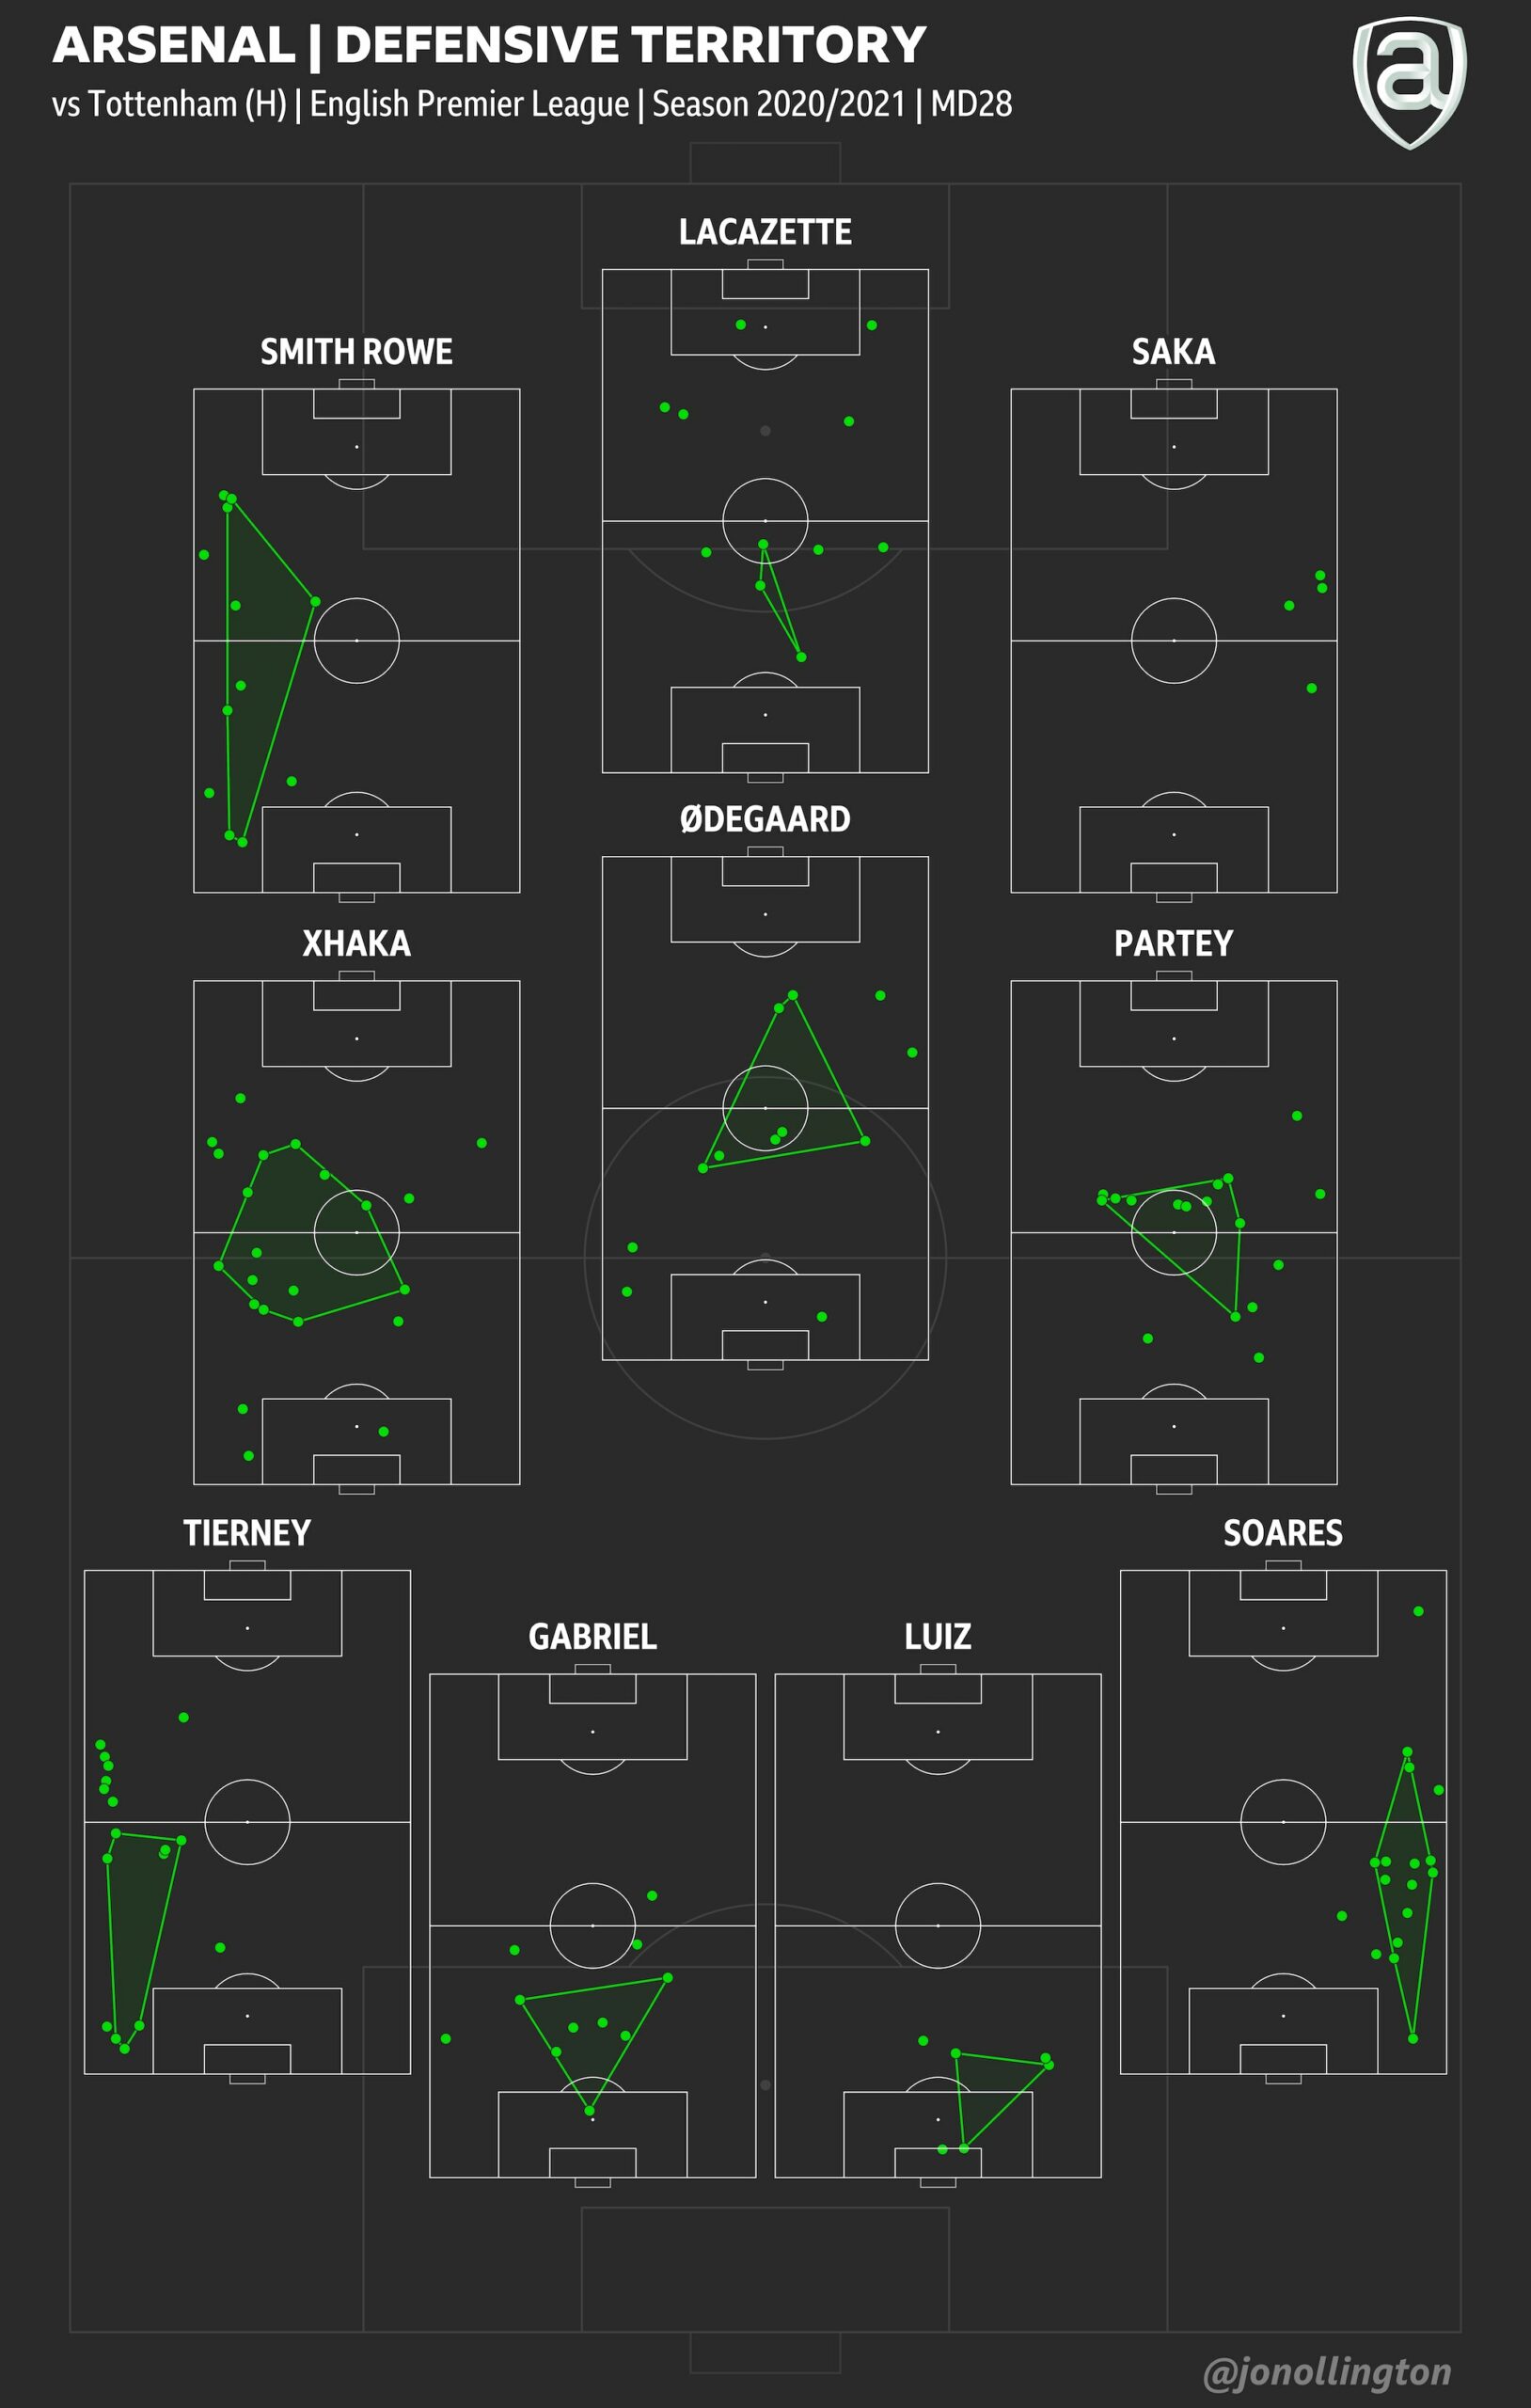 Above are the individual defensive actions for Arsenal’s starting XI and the average territory covered by those defensive actions less outliers.
Granit Xhaka was also impressive during Sunday’s win – both influential in stopping transitions and retaining possession. He is more than capable of producing such displays for the Arsenal and as I mentioned in the previous columns – there is much to like, but the perpetual mistakes are never far away. However, when the errors don’t rear their ugly head, it’s easy to comprehend why he’s been so highly rated by managers past and present.
Xhaka was first for Tackles and Interceptions (5), and pressed well throughout. The Swiss international completed 96% of his 68 passes made – leading all players.
Kieran Tierney’s defensive performance also warrants mentioning – the Scot won 100% of his duels and boasted a 100% tackle win rate as he continually sought to drive Arsenal forward, but never once forgot his defensive responsibilities.
 Above are the collective defensive actions for Saturday’s encounter from both sides – defensive actions include challenges, aerial duels, tackles, ball recoveries, interceptions and fouls.
And finally, the above plot illustrates Tottenham’s intentions going into the North London Derby – sit deep, absorb pressure and catch Arsenal on the break. It’s a tactic that has worked so well in the past for Jose Mourinho, but yesterday credit has to be given to Mikel Arteta. The Spaniard dropped his captain for disciplinary reasons, and kept to his footballing philosophy, as his Arsenal team finally caught a break and produced a performance that not many predicted before kick-off.
He has now defeated every manager in the Premier League ‘Big 6’ and hopefully his Arsenal side can kick on from here and finish their season strongly.
—
Follow me on Twitter @jonollington


Lacazette man…. Playing against us
Great visuals & piece of work @Jon.
Here’s hoping that this is actually not the biggest week in Arsenal’s season😉…. but that this one will come in May
COYG!
Haha – too true.
Very impressive stats lad. It’s easy to get bogged down in meaningless stats with no context as to why they occur. You completely avoid this and your articles are interesting and informative. Thanks a lot.
Jon these are genuinely brilliant pieces your writing – so clear and detailed. I really love your clear explanations of the different metrics – even though you use PVA and so on each week, I still need the explainer every time to really grasp it, so thank you!
Great presentation of the data and relatively easy to understand.
Who knew that a functioning midfield would make us better? Oh yeah – everyone knew! One more great signing into the midfield and we will really be cooking with gas. As long as we keep Martin of course
Thanks once again. Could you please explain more on Odegaard? You note his excellent attacking pass stats and that he produced a MoM performance. However your visual of ‘net possession’ shows at the same time he decreased the chance of us scoring more than any other Arsenal player. How should we interpret this please?
In simple terms – Odegaard played a lot of passes towards the opponents goal, but he also passed both sideways and backwards more than usual. EPV using a static grid is limited – it’s useful to give a basic understanding of who played the most ‘dangerous’ passes, but it should always be used in context of the match. For example, Tottenham sat deep and as a result gave Arsenal’s attackers less opportunity to always pass the ball forwards. Sideways and backwards passes will generate a negative possession value, but aren’t necessarily negative when considering actual game state. I felt it… Read more »
You have to remember as well that possession is also the best form of defence, especially against a passive counter attacking team.
They were essentially waiting for mistakes. Mistakes, which from ESR and Odegaard, never came.
Nice work Jon, these are really coming together. One thing I’m not sure about is the defensive actions zones – the polygons are a nice idea but based on the outliers it looks like they’re not particularly representative of the underlying story… the node choice seems unintuitive. Might it be better to use a heatmap, or 95%CI contour? Also for the passmaps, any thoughts about adding Pepe on the right of Saka, perhaps running over the touchline in the underlying graphic, esp since they were equal-time subs. Based on the NPV barplots it seems Pepe was worse than Saka so… Read more »
Agreed – I really like the plot (hence why I keep on using it), but the hulls are more tricky to achieve than I originally gave credit – I use z-scores and they’re based on a single distribution. For the most part it works, but if a player has two peaks, the z-score might not pick up the right area.
I’m aiming to have the substitutes added by the next game.
There will be improvement/tweaks made to all the plots in time. I always read the comments and genuinely appreciate the feedback.
Jon, mate! Wow! so much work must have gone into that, really well done.