

A glossary of some of the stats that I use during the writing of the by the numbers posts. If I am missing anything let me know and I will add it.
xG (Expected Goals)
I am not the biggest fan of this name, I preferred “Chance Quality” but it is too late to go back and change it. The best way to think about xG is that it is the probability of a shot turning into a goal, ranging from 0 (0% chance of a goal scoring) to 1 (A goal is always scored). In my model, generally the lowest numbers are for really long shots with a bunch of players between the shot and the goal and those will rate at around 0.02 (2%) with the best chances, from say a few feet out and an open goal rating at around 0.97 (97%).
The model is built upon data from the big five leagues of Europe and takes into account as much data as I can get my hands on. The biggest factor is the distance to goal (obviously) and the angle that the player has to goal (more central is better), was it taken with the head? feet? or other? (headers are hard). There is also information on how the shot was assisted, was it a cross (in general this makes a chance harder), a cut back (this is a positive type of cross), through ball (these are really good), pre-assist through ball (sometimes the pass before the key pass broke apart the defensive line and that is important information to know), shot from a rebound (in general this is against a scrambling defense and a positive factor), did it come from a corner or any other set play and was it assisted at all.
I also get data (the Thursday’s after matches from the weekend so this won’t be typically in the by the numbers) from StrataBet that includes measures for the defensive pressure on the shot, the number of defenders (and attackers) between the shot and the goal, a rating of the shot quality (how well it was placed) and a rating of the chance.
Best xG Chances of Week 1 from Crab Stats on Vimeo.
The above video is the best chances from week 1 of the Premier League with descriptions of the biggest factors that go into determining the xG rating for each chance to illustrate how the rating is derived.
Shot on Target xG (SoT xG)
This is very similar to the regular xG model except that when the values for the different variables are run through the regression model only shots on target are considered. All shots that are blocked or miss the target are assigned an xG value of zero. With this, shots that end up on target will have a higher value than the corresponding regular xG model.
Over the course of the season these two will be very similar but in a single match, the number of chances on target varies quite a bit and can be a better descriptor of what actually happened. I also use this model when I am looking at goal keepers and how well they save shots, for example David De Gea for Manchester United last season.
Post Match Simulation
After each match, I run a Monte Carlo simulation of the match 10,000 times. This simulation uses the shots that each team produced during the match to give the probability of the outcome, goals scored, goal difference and expected points.
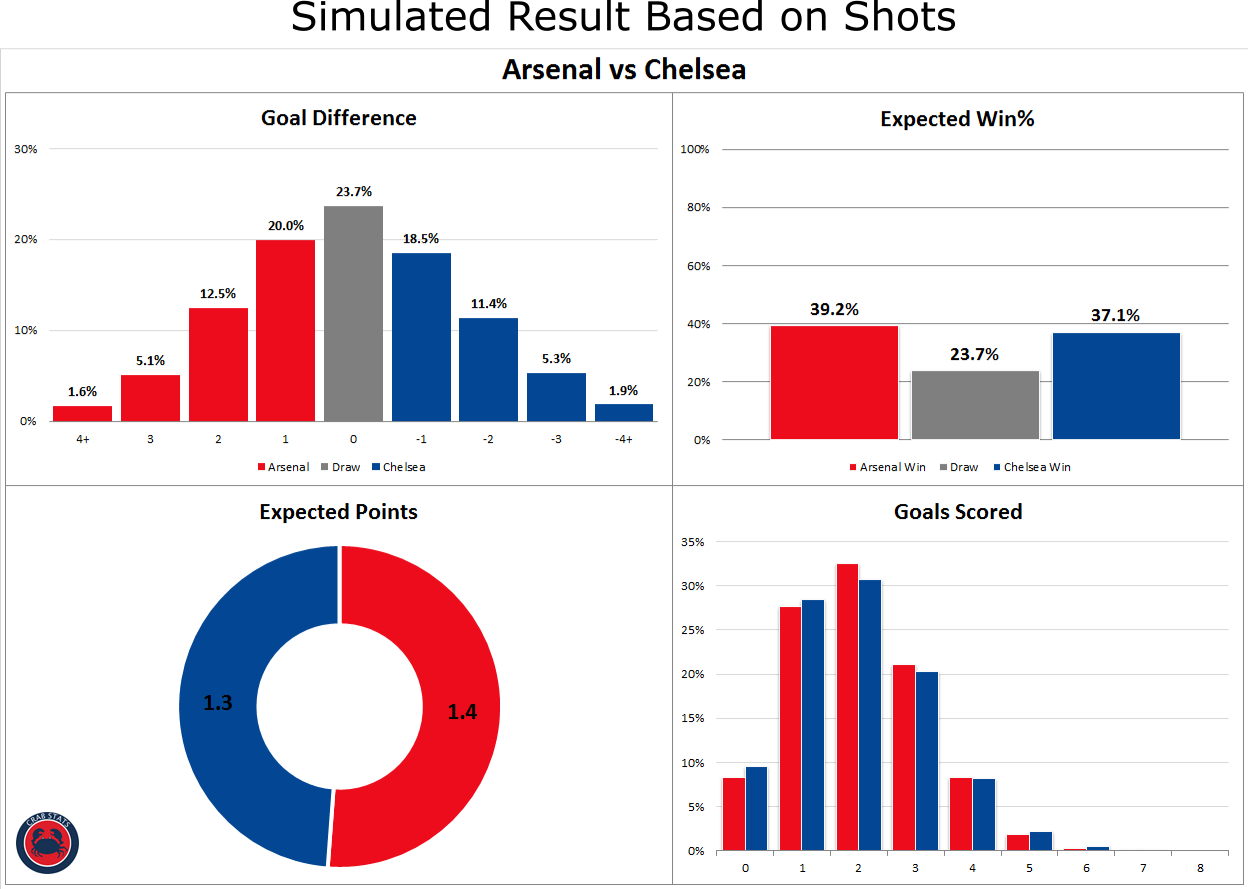
This is an estimation of how this match would typically play out and what the odds are that a certain result would have occurred.
There are major caveats that come with this: one each shot is not independent of each other like the model assumes. If a shot is saved it can produce a rebound, corner, clearance that produces another shot or even a fast break the other way, but if it scores none of these can happen. This is assumed away by this model for simplicity. The second major caveat is that the model also does not take into account game state effects (this will get its own section) which tl;dr basically mean if a team is ahead they don’t attack as much. I still find value in these but I don’t draw massive conclusions from them as the margin of error is quite large.
Game State
If you read above you got the short version, this is the longer version. Matches are effected quite a lot by the score (and also the expectations of the two teams before the match even starts) and will effect how the match is played and the stats that follow.
When a team is winning, they are less likely to go all out attacking. You will see the number of shots go down, but the average quality of the chances the do take going up. The reverse is also true for teams down a goal or more, they will commit more players to attack, taking more shots, generally from longer distance (usually though a packed box) and rely more on crosses to create offense (scoring headed shots from crosses is really hard).
You also have effects based on what the team expected before the match. If you get a small team vs a big team, and they are drawing (or even only losing by one goal to preserve that goal differential) late in the match they might sit back and defend deeper than a normal team in the same situation who would think they have a chance to win the match.
Actually quantifying these things is hard and when I present stats I will usual caveat things instead of trying to make some sort of adjustment that would likely introduce more noise into the analysis. Over the course of the season these will likely balance out but will definitely create outliers in small samples.
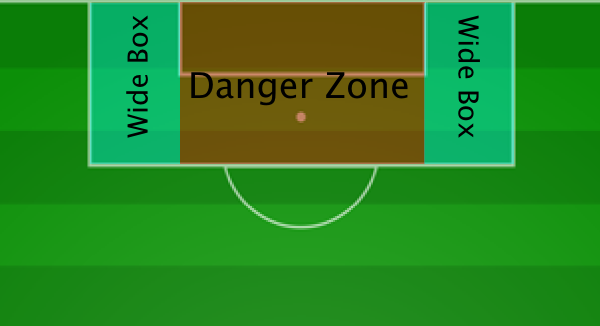
Danger Zone
Kenny Loggins and Top Gun are awesome but this stat refers to the area in the center of the 18 yard box plus the six yard box. The majority of goals come from this section. (Sorry if the song is stuck in your head now)
Offense Value Added (OVA)
The short answer is that it is a stat that looks at all of the offensive actions that a player contributes to and attempts to quantify how much value added they had for the team. This stat is scaled to goals, so a player contributing 1 OVA would be worth about a 1 goal to the offense.
The stat is derived by going through four years of data, looking at when an action happens at a certain coordinate on the pitch what is the likelihood that possession later turned into a goal. So when a player starts a possession the value of where they started is recorded and then compared to the value where the possession ended. The difference between these two is the offense value added.
This is a rough calculation for the different values on the pitch.
Offense value added also takes into account negative actions, such as losing the ball, or missing a pass. For these there is a negative effect plus the value for where the opponent takes over. There are also bonuses for creating big chances, completing through balls, dribbles, and being the one that is on the end of a big chance.
The main idea is that this is a good way to try to account for how much each player contributes to the offense. Essentially this my attempt at a next level xG Chain (look below for that one). I use this for individual players and will also use this to look at team level results as a kind of non-shot xG model. An example of the Belgium vs France Semi Final Running OVA from the World Cup:
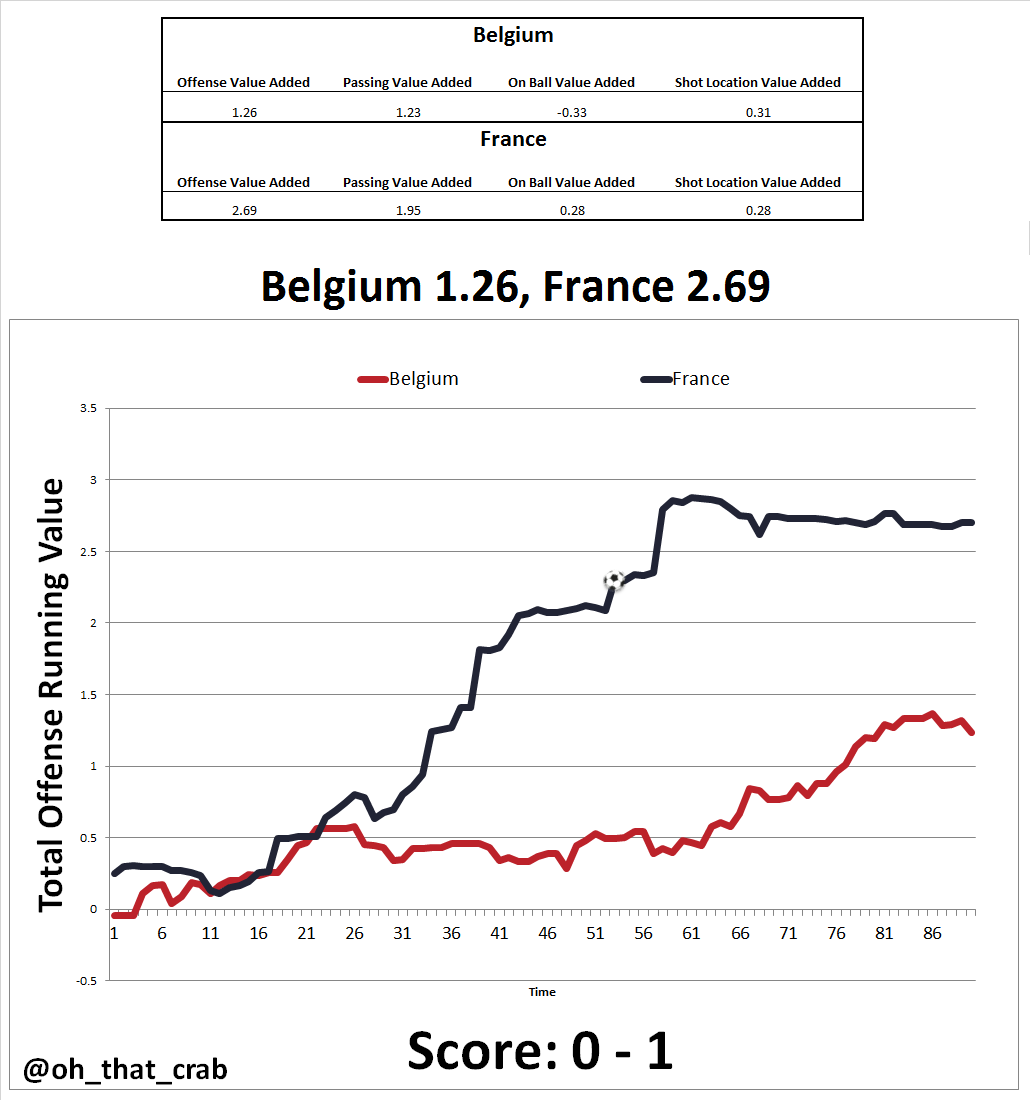
It isn’t perfect but I think it is a step in the right direction to assigning value to actions on the pitch. This is also a decent example of game state effects, France dominated the match but after going a goal up, they were more content to keep their defensive shape over risking scoring a second goal.
xG Chain and xG Buildup
xG Chain and xG Buildup take the work done on xG and merge it with passing chains. What his stat does is assign the xG value to everyone who was involved in the possession that lead to the shot.
The 2nd goal in full. Really enjoyed Mhkitaryan’s movement in this, moving from left to right of Jorginho to completely overwhelm him. pic.twitter.com/y2XBMCp0fb
— Arsenal Column (@ArsenalColumn) August 19, 2018
For example in this move against Chelsea: Sokratis, Cech, Mustafi, Monreal, Xhaka, Iwobi, Özil, Guendouzi, Bellerin, and Mkhitaryan all get xG Chain credit of 0.4 for this move. (One of the draw backs of this is that everyone gets the same credit even if they don’t add the same value, see above for my alternative)
xG Buildup has the same exact structure but excludes the shooter and the player playing the key pass (unless if they were involved earlier in the move). So for this example Sokratis, Cech, Mustafi, Monreal, Xhaka, Iwobi, Özil, Guendouzi, and Bellerin would get credit. Iwobi DOES get credit because he made a contribution to the buildup to the shot. There is also no double counting in these, doing one pass is the same as making three.
Conversion rates, Goal Efficiency
One of the things that I am interested in is looking at conversion rates and overall goal scoring efficiency. I think looking at conversion rates for shots is a great way to help determine if a player is going through a fluky hot streak, an unlucky cold or is just really good or bad.
The first one that I like to look at is on target accuracy, total shots on target/total shots. In general about 33% to 35% of shots end up on target, but varies depending on where the shots are coming from.
From this you can see interesting things, as of this writing (23 August, 2018) Everton are putting 60% of their shots on target. That goes a long was to understanding why they have 4 goals from 20 shots. The flip side would be Cardiff City who have 22 shots but are putting just 9% on target but have scored 0 goals. Both teams have similar xG for the season (2.9 vs 2.2) but have a big difference in goals scored (4 vs 0).
Next I like to look at conversion rate, which is goals scored/shots on target. This is another similar stat but looks at ability to turn shots on target into goals. Typically between 30% and 35% of shots on target are converted into goals.
From this you can see interesting things, as of this writing (23 August, 2018) Brighton are converting 100% of their shots on target into goals (2 non-pen shots on target, 2 goals) while West Ham have a 0% conversion rate (6 non-pen shots on target, 0 goals).
Going one step further I like to take both of these metrics and apply them to Big Chances. Big chances are put on target about 55% of the time, converted at about a 40% rate with an on target conversion rate of about 60%.
Arsenal so far (23 August, 2018) have created 5 big chances, put just 20% on target, converted just 20% and scored the only one they put on target. With so few big scoring chances in a match putting these in the back of the net are very important.
Lastly are the efficiency stats, these take goals scored/xG (or SoT xG) and provide a quick way of determining how well a team or player has done in converting chances into goals.
Passes Per Defensive Action (PPDA)
This is the current best way to define how much and where a team presses (at least with those who only have access to on ball event data). It looks at the number of defensive actions: tackles, interceptions, blocked passes, clearances and fouls a team has per pass the opponent attempts. So a team that has a fewer passes allowed per defensive action would be considered a higher pressing team. This can be broken up into different areas of the pitch to get an idea of where the defensive pressure happens.
Have more questions? Let me know in the comments and I will expand this as needed.


All good to know thanks.
Look forward to future analysis, interesting to see the story of players, games, seasons and the team shown numerically. Thanks for the ones you’ve done already.
Very interesting, thanks for this. Nice to have the curtain pulled back on these advanced metrics. I was looking through your by the numbers for the Chelsea game, maybe I’m missing it, but do you assign the individual xG numbers for specific chances? Like the Aubameyang sitter?
Yes every chance is assigned an xG value
Well I’ve finally reached the limits of my intelligence. I think I even started drooling a bit. Seriously, thanks for the info and your segment on the AV Pod.
This is incredible.
I am really looking forward to upcoming ‘by the numbers’. I’ve always liked them but the detail you go into is very impressive.
It really paints a picture, thanks for a new look at our games.
Please can you keep writing expected goals next to xg, for example, because I know I’ll keep forgetting what they all mean!
Always a good read. I have learnt so many new things about football reading Arseblog over the years. Cheers
Great idea to clarify all of these terms Scott. If you don’t mind me asking, where do you get such detailed data? Particularly player coordinates over time, that you would use to compute OVA?
Opta has xy coordinates for the on ball events and that’s where I get that from
Thanks for the reply! And looking forward to your articles this season 🙂
Call me old fashioned.. but I am more excited to read basic stats in this section.. chances created, shots, tackles, interception and maybe sometimes appearances and those kinds too..
Totally respect your work and effort though! Just incorporate the basic stuff more for us lot!
It’s putting the numbers, complicated or simple ones, in a story that is most important.
If there is no story the numbers won’t make sense or be interesting. However if the numbers show the effect of a tactical change or how a player has improved etc etc then they become fascinating.
I think that these are still very valuable and will certainly use them
No no nooo. Go back to simplicity. This all doesnt make sense. By the numbers are not fun anymore. Keep the numbers with you and tell us the bigger catchy results. Its not a stats class for gods sake.
Shots off target, shots on target, chances created, total passes, passes completed, pass completion percentage, through passes, tackles attempted, tackles won, interceptions, saves, clear cut chances conceded, clear cut chances saved and per90 averages for comparisons for the longer term. You can use words to explain what the stats tell you. I like your opinion on how you see the stats, but when you give me all your info and then explain things I can already look at, it just seems like weird to me. We watch the games, we just need the stats to confirm or elaborate what we… Read more »
A lot of why I do this is to be able to put the raw stats into context. Okay, that shot is off target, how often does that happen?
Pass completion percentage is nice, but it is important to also try to understand how hard the passes attempted were. Were they sideways? Well than maybe a 85% passing rate isn’t impressive, where they taking place in the final third and several attempts into the box? Well now that 85% IS impressive.
The good thing is that a lot of the baseline work is done. 🙂
This is fantastic, thank you so much! I really appreciate the time and effort you put into these metrics. The monte carlo simulations were particularly fascinating.
Thanks
Appreciate your work. Similar to your post match simulation I also see you tweet the pre-match projections. Roughly, What all do you take into account to come up with those numbers?
the short story is that it is built on shots for and allowed (with other adjustments) If you are interested in the methodology of the model this was the basis: http://crabstats.blogspot.com/2017/09/explaining-my-simulation-methodology.html
And these were the updates that were made for this year: https://www.patreon.com/posts/pre-season-20435864
Great post Scott, also appreciate the way you pointed out caveats and assumptions so that we can have a more nuanced understanding ofthe stats and model outputs presented.
Regarding OVA…would a backwards pass give
oops, apologies for the double post, accidentally hit post due to my fat fingers not being able to work the touchscreen on my phone.
Great post Scott! Thanks also for highlighting the caveats and assumptions of your models so that we can have a more nuanced understanding of what they show. With respect to OVA, does a backwards pass result in a negative OVA value? Presumably the action would result in the ball ending up in a “lower OVA value” area of the pitch then where it started (most of the time at least, cutbacks in the box being an obvious exception) and thus, according to how you explained OVA is assigned to passes, yield a negative number. However, a back pass is not… Read more »
So, basically, Arsenal have been wasteful. Thanks for the obvious.